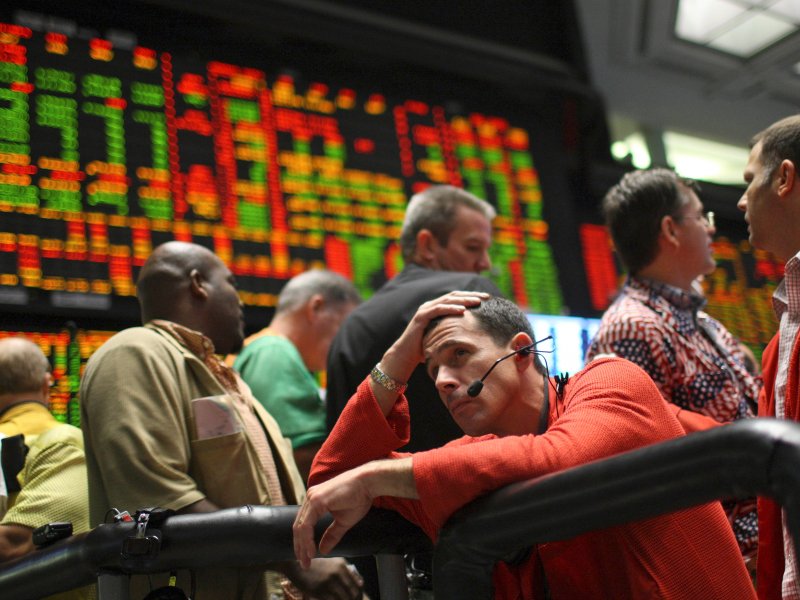
- A "non-stop euphoric cabaret" of stock sentiment indicators are flashing bearish right now.
- Bank of America Merrill Lynch (NYSE:BAC) chief investment strategist Michael Hartnett forecasts that the S&P 500 will decline roughly 6% before the end of the first quarter.
Every week the stock market hits new highs. And every week the number of sell signals grows as conditions get more stretched.
It's an inevitable result for a scorching-hot equity market that's enjoying overpoweringly strong sentiment. And it's something that appears to be largely ignored by investors hungry for even more returns.
For starters, a gauge maintained by Bank of America Merrill Lynch — known as the Bull & Bear indicator — is on the brink of reaching sell territory. It hit 7.9 last week, dangerously close to the 8 threshold that's portended a selloff on 11 out of 11 occasions since 2002, according to BAML data.
To further drive home the market's maniacal quest for more returns, equity funds received a record $33.2 billion this week, including an all-time high of $12.2 billion to active funds, BAML data show. The fact that these massive flows occurred with major indexes at record levels reinforces just how confident — and perhaps overconfident — trader behavior has become.
Bank of America Merrill Lynch chief investment strategist Michael Hartnett, who has been repeatedly warning about overexuberence for months, colorfully describes this confluence of factors as a "non-stop euphoric cabaret."
He's so concerned, in fact, that he's calling for a tactical S&P 500 pullback to 2,686 — a roughly 6% decline from current levels — at some point in February or March.
But the sell signals that have Hartnett so worried don't end there. Not even close.
Here's a comprehensive breakdown of the other indicators suggesting that stocks are overheating:
The longest overbought streak in 21 years
The S&P 500's relative strength index has been above the 70 level that indicates an overbought condition for 16 straight days, the longest such streak in 21 years, according to data compiled by Bloomberg. Morgan Stanley (NYSE:MS) also made a similar observation last week.
The shortest gap between new 100-point S&P 500 milestones since the global financial crisis
It took the benchmark equity index just 13 trading days to travel from 2,700 to 2,800, by far the shortest gap between 100-point milestones since the financial crisis, according to data compiled by CLSA. "Market participants are flying closer and closer to the sun, trusting that their wings aren't made of wax," the CLSA investment strategist Damian Kestel wrote in a client note.
A gauge of US economic strength is headed in the wrong direction
The Citigroup (NYSE:C) US Economic Surprise Index — which measures the degree to which economic data exceeds forecasts — has started to fall after hitting a five-year high in December, according to Bloomberg data.
BAML client equity exposure is rising at the fastest pace in 10 years
While it's common sense that equity exposure would be at high levels amid such a historic bull market run, the real takeaway here is the rapidly accelerating pace.
Had enough? We'll leave it at that for now, but just know that there are statistics like this littered around the stock market like minefields, spring-loaded to unleash fury.
But when? That's the key question. At this point, no one knows for sure, and forecasts are scattered all over the place. Equity strategists across Wall Street are, on the whole, still bullish, but hedge fund managers and other investment specialists have been sounding the alarm on a market event for a while now.
In the meantime, faced with the mountain of bearish data above, you're probably best off buying some downside protection, just in case. Unless you like living on the edge. In which case, good luck.