By John McCrank
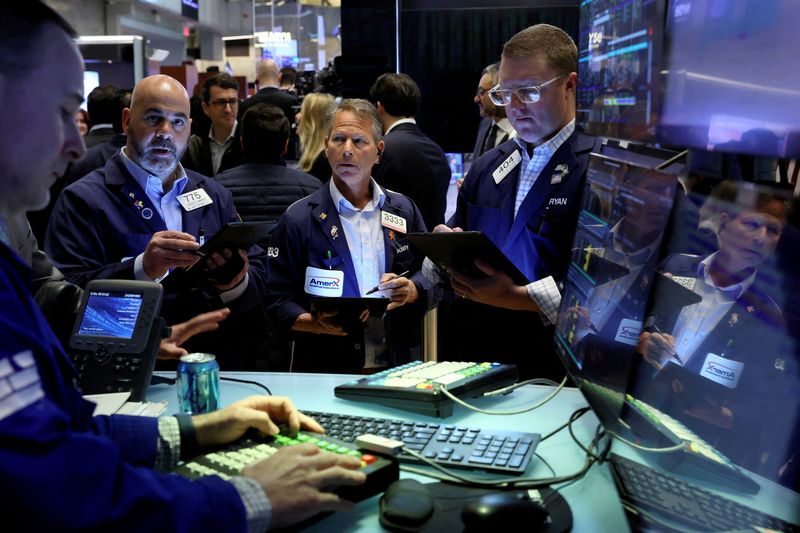
NEW YORK (Reuters) - The sudden drop in European shares on Monday following an erroneous trade in the Nordic markets is the latest example of a "flash crash" in which the price of an asset quickly drops before bouncing back.
The term "flash crash" became part of the market's lingo after the Dow Jones Industrial Average cratered around 1,000 points in May 2010, wiping out nearly $1 trillion in shareholder value before mostly rebounding in a matter of minutes.
Flash crashes are examples of extreme market volatility or structural problems and they can erode investor confidence.
Most are the result of human error, such as "fat finger" mistakes where a trader may accidentally add an extra zero to an order or accidentally request a large order be immediately executed rather than dripped into the market. They can also be caused by computer glitches and algorithms gone wild.
Here are some examples of recent flash crashes:
Dec. 4-5, 2021: Cryptocurrency bitcoin crashed, wiping out a fifth of its value and leading to $2 billion worth of positions being liquidated.
Feb. 25, 2021: The prices of Treasury securities https://www.federalreserve.gov/econres/notes/feds-notes/the-treasury-market-flash-event-of-february-25-2021-20210514.htm dropped sharply amid strained liquidity conditions, before recovering within about an hour.
Aug. 26, 2019: The Turkish lira tumbled as investors cut risk exposure and briefly boosted the safe haven yen against the lira.
Jan. 3, 2019: Major currencies experienced a flash crash against the yen, driven primarily by technical, not fundamental, factors.
Oct. 7, 2016: Sterling lost as much as 10% of its value in just a few minutes of trading, fueled by concerns about the vulnerability of the currency and other British assets to Brexit.
Aug. 24, 2015: U.S. equity markets and equity-related futures markets experienced unusual price volatility https://www.cfainstitute.org/en/advocacy/issues/flash-crashes#sort=%40pubbrowsedate%20descending, sending the SPDR S&P 500 ETF Trust (ASX:SPY) down 7.8% five minutes after the market opened. The ETF recovered its losses within the next five minutes.
Oct. 15, 2014: The market for U.S. Treasury securities experienced high levels of volatility and Treasury futures prices fell rapidly amid diminished liquidity. The incident sparked a regulatory investigation. While that found no single cause, it noted record trading volumes, a decline in order book depth, and changes in order flow that day that may have contributed to the crash.
May 4, 2010: Unsettled market conditions combined with a massive sell order for a popular futures security sent the Dow plunging around 9% in a matter of minutes before rebounding.

The event was coined the "flash crash," and it led U.S. regulators to a safeguard known as "Limit-Up Limit-Down," that prevents stocks from trading outside a specific range based on recent prices, pausing trading in the stocks in question when prices breach the bands.
In 2016, a London-based trader was convicted of manipulating the futures market in a way that contributed to the 2010 flash crash.
