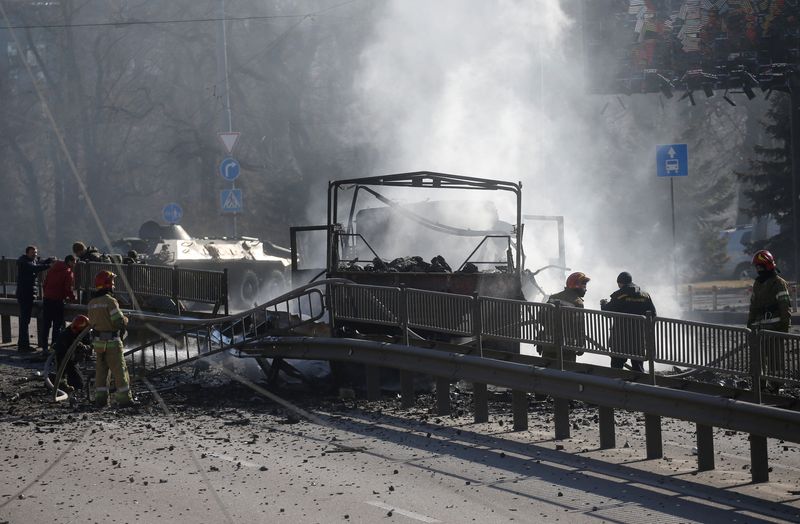
LONDON (Reuters) - Russia launched a full-scale invasion of Ukraine this week, sparking a slew of sanctions and turmoil in global financial markets.
Below are six charts showing the week's dramatic moves in financial markets:
ENERGY SURGE
Fears of a potential supply disruption on oil markets from the war in Ukraine saw crude prices surge above $100 a barrel for the first time since 2014, with Brent touching $105. [O/R] UK and Dutch gas prices rose about 40%-50% on Thursday. Both crude and gas prices came down on Friday, markets remain jittery. [NG/EU]
While a raft of harsh sanctions imposed by western capitals has not specifically targeted Russia's oil and gas flows, top buyers of Russian oil were struggling to secure guarantees at Western banks or find ships to take crude from the country.
Russia is the world's second-largest crude producer and provides around 35% of Europe's and 50% of Germany's natural gas supply.
(Graphic: Oil and gas prices jump - https://fingfx.thomsonreuters.com/gfx/mkt/xmpjoelrbvr/Gas%20and%20brent%20prices%20jump.PNG)
INFLATION FEARS
Soaring energy prices fuelled a dash for inflation-linked bonds - securities whose payouts rise in line with inflation.
That has sent real yields - borrowing costs after adjusting for inflation - sharply lower, while so-called breakevens, indicating where markets see future inflation, rose sharply.
Essentially, that implies belief that central banks may have to go slower than earlier forecast with interest rate rises to battle inflation as economic growth also takes a hit.
Yields on rate-sensitive Treasury Inflation Protected Securities (TIPS) slipped while breakevens rose towards 3% this past week. In Germany, vulnerable to surging European gas prices, two-year real yields slumped around 30 bps and breakevens rose as high as 3.7% TIPS funds received net inflows for the first time in five weeks, BofA data shows.
(Graphic: Breakevens - https://fingfx.thomsonreuters.com/gfx/mkt/gdvzybwmgpw/Pasted%20image%201645818345907.png)
STOCK MARKETS: BEWARE OF THE BEAR
Thursday's market rout wiped nearly $1 trillion off the value of the global stock market and accelerated a drop in the major indexes that has come this year as investors have started to get jittery about major central bank rate hikes.
The tech-heavy U.S. Nasdaq flirted with "bear" market territory, as a 20% fall from the last peak is known, but U.S. markets ended up closing higher despite all the damage elsewhere and were making more ground on Friday.
Europe's 3.3% drop for the STOXX 600 took its recent reverse past 10%, but it then bounced just as much on Friday.
MSCI's 24-country emerging markets index meanwhile did earn its "bear" market tag as its 4.3% drop on Thursday left it down just over 20% from a record high almost exactly a year ago.
(Graphic: Major equity indexes in correction territory - https://fingfx.thomsonreuters.com/gfx/mkt/gkplgawxovb/indices.JPG)
RUSSIAN ROUT
Predictably, Russia's stock market was hit the hardest on Thursday. Moscow's MOEX exchange slumped a record 33% having plunged more than 1,000 points at one stage as traders braced for stiff sanctions. MSCI's Russia index crashed 38%. Analysts estimate that it was one of the top three stock market crashes of all time.
(Graphic: Russian stock market plunging far more than during other crises - https://fingfx.thomsonreuters.com/gfx/mkt/xmvjoekmepr/Pasted%20image%201645779548050.png)
UKRAINE DRAIN
Ukraine was hit just as hard. Its currency and government bonds crashed violently, with investors wondering whether the country would be able to avoid another sovereign default.
(Graphic: Ukraine bonds drop - https://fingfx.thomsonreuters.com/gfx/mkt/gkplgaxdavb/Pasted%20image%201645805780289.png)
SOARING WHEAT & GRAINS
Wheat prices hit their highest since mid-2008 as markets tried to gauge the consequences on grain and oilseed supplies from the conflict between Russia and Ukraine - two of the world's biggest exporters.
Interruption to the supply out of the Black Sea region will put pressure on prices and further drive up food inflation at a time when affordability is a major concern across the globe following the economic damage caused by the COVID-19 pandemic.

Ukraine's military on Thursday suspended commercial shipping at its ports after Russian forces invaded the country. Russia earlier ordered the Azov Sea closed to the movement of commercial vessels until further notice, but kept Russian ports in the Black Sea open for navigation.
(Graphic: Ukraine crisis send wheat prices soaring - https://fingfx.thomsonreuters.com/gfx/mkt/egpbkqmayvq/Soaring%20food%20prices%20Russia%20Ukraine.PNG)