⏳ Final hours! Save up to 60% OFF InvestingProCLAIM SALE

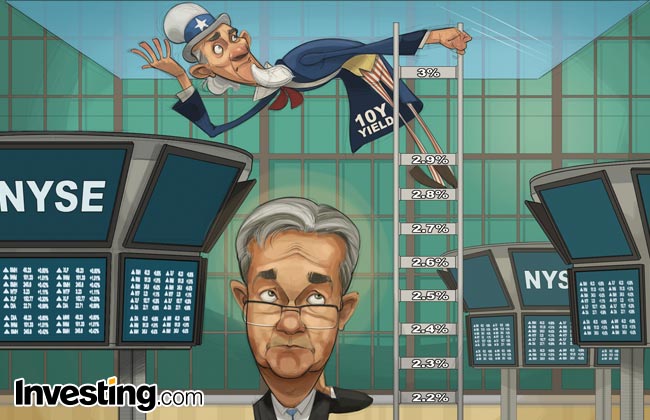
Weekly Comic: U.S. 10-Year Treasury Yield Nears 3%; What Next?

Published 02/15/2018, 06:17 AM
US500
-
GS
-
US2YT=X
-
US5YT=X
-
US7YT=X
-
US10YT=X
-

Investing.com - U.S. Treasury yields continued higher, extending this year's rally, with the benchmark 10-year note reaching an intraday high of 2.944%, a level not seen since January 2014.

It was last at 2.930%, up 1.7 basis points, or 0.6%, in early action Thursday, inching ever closer to the 3%-threshold.

The 10-year yield has not been above 3% - the point at which strategists and fund managers say equities will really hurt - since early 2014 and some investors believe that level will be tested in the days ahead. It started the year at 2.4%.

And it's not just the 10-year yield which has been shooting higher. The 7-year note yield hit a high of 2.877%, its strongest level since April 2011, while the 5-year yield touched a peak of 2.687%, a level last seen in April 2010.

The latest moves came after data on Wednesday showed U.S. consumer prices rose slightly more than forecast in January, with core inflation posting its biggest gain in a year.

That again stoked fears that the Federal Reserve will be forced to raise interest rates at a faster pace than expected this year. Indeed, the market is adjusting to the idea that the Fed will increase borrowing costs four times in 2018, more than the three times it currently forecast for this year.

If yields continue to breakout, that will certainly start weighing on equities again. Rising bond yields can crimp demand for assets perceived as riskier, such as stocks, particularly when those yields are higher than those of equities.

According to strategists at Goldman Sachs (NYSE:GS), 10-year yields will rise to as high as 3.5% in the next six months, which many consider the “pain threshold” for equities as it makes them less attractive than fixed-income assets.

At current levels, 2-year Treasuries yield almost 2.2%, compared with the 1.8% dividend yield on the S&P 500, a bad sign for stock bulls.

To see more of Investing.com’s weekly comics, visit: http://www.investing.com/analysis/comics
Latest comments

Risk Disclosure: Trading in financial instruments and/or cryptocurrencies involves high risks including the risk of losing some, or all, of your investment amount, and may not be suitable for all investors. Prices of cryptocurrencies are extremely volatile and may be affected by external factors such as financial, regulatory or political events. Trading on margin increases the financial risks.
Before deciding to trade in financial instrument or cryptocurrencies you should be fully informed of the risks and costs associated with trading the financial markets, carefully consider your investment objectives, level of experience, and risk appetite, and seek professional advice where needed.
Fusion Media would like to remind you that the data contained in this website is not necessarily real-time nor accurate. The data and prices on the website are not necessarily provided by any market or exchange, but may be provided by market makers, and so prices may not be accurate and may differ from the actual price at any given market, meaning prices are indicative and not appropriate for trading purposes. Fusion Media and any provider of the data contained in this website will not accept liability for any loss or damage as a result of your trading, or your reliance on the information contained within this website.
It is prohibited to use, store, reproduce, display, modify, transmit or distribute the data contained in this website without the explicit prior written permission of Fusion Media and/or the data provider. All intellectual property rights are reserved by the providers and/or the exchange providing the data contained in this website.
Fusion Media may be compensated by the advertisers that appear on the website, based on your interaction with the advertisements or advertisers.
© 2007-2024 - Fusion Media Limited. All Rights Reserved.