Forex News and Events
Bearish USD
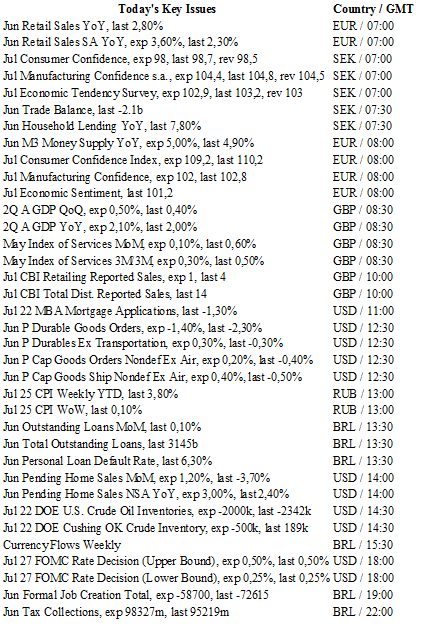
FX markets are in a sideways consolidation pattern ahead of tonight’s FOMC rate decision. The general expectation is for a slightly more positive economic assessment, based on the firmness of incoming data, more specifically solid June payrolls and a relatively smooth market reaction to Brexit. With no “dots” or press conference, traders will have to be content with dissecting the wording of the accompanying statement, which is never an exact science. We suspect that the market is over-positioning USD for a hawkish tone (12% for a 25bp hike), as the Fed is unlikely to signal anything without GDP data and a broader view of the Brexit fallout. Given our base scenario of a low probability Nov/Dec rate hike we do not anticipate the Fed trying to bring forward rate hike expectations. We remain sellers of USD on dips as the statement should be more dovish.
Elsewhere, US data continues to recover from spring’s soft patch. New home sales in June rose 3.5% m/m, to 592k against 560k expectations, with the prior month’s sales revised higher - by 22k. However, US home prices came in weaker than expected in May as the S&P/Case-Shiller 20-city home price index disappointed in May, declining by 0.1% m/m. We suspect that divergence between sales and prices are a clear indication of low IR distortion and a possible bubble. Finally, The Conference Board's index of consumer confidence was basically unchanged at 97.3 in July - above a consensus of 96.0. The solid read suggests that household sentiment is gradually improving.
UK GDP surprises to the upside
This read obviously does not capture a Brexit vote fallout. Despite dire predictions of uncertainty driving activity to a standstill, ahead of the UK referendum, UK Q2 GDP printed above expectations. UK Q2 GDP q/q rose 0.6% from 0.4% against 0.5% expected (y/y 2.2% vs. 2.1% exp). In actuality, growth accelerated as business raced ahead of the uncertain vote (lead by industrial output). This unexpected read indicates that the UK economy was in stronger position ahead of the vote then originally forecasted. However, this preliminary estimate does not capture the post referendum fallout, which is likely to drive Q3 lower, possibly into recession. We remain bearish on the GBP as the UK economy will clearly go through a period of economic adjustment and likely BoE interest rate cuts.
Australia CPI hits lowest level in 17 years
The latest inflation report from Australia came in on the soft side but was still better than anticipated by economists. Headline CPI rose 1.0%y/y or 0.4%q/q in the June quarter, roughly matching the median forecast. On the bright side, the RBA’s preferred measure of inflation - the trimmed mean, which excludes the highest rises and declines among CPI components - massively surprised to the upside. It rose 0.5%q/q (0.4% exp. and 0.2% in 1Q) or 1.7%y/y (1.5% exp. and 1.7% in 1Q), clouding the issue of the next RBA rate decision on August 2.
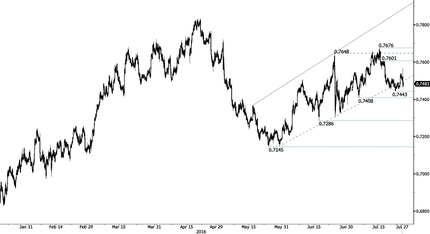
Indeed, even though the inflation report is far from being encouraging vis-à-vis Australia’s inflationary outlook, it does take some heat off the RBA, giving more room for Stevens to delay a potential interest rate cut next Tuesday. From our standpoint, this report does not change much in the RBA’s thinking as the overall trend in inflation is negative; and the latest uptick suggests, at most, a stabilisation and not a reversal. We therefore continue to expect that the RBA will cut the cash rate target in order to bring core inflation within the 2% to 3% target band. Consequently, the Australian dollar still has downside potential and should resume its debasement towards the $0.73 level as a first step.
AUD/USD - Bouncing. 

The Risk Today
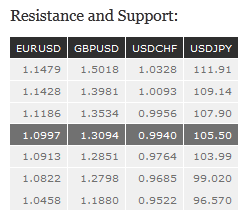
EUR/USD is moving sideways in a range defined by the support at 1.0965 (25/07/2016 low) and the key resistance at 1.1030 (26/07/2016 high). Stronger resistance is given at 1.1428 (23/06/2016 high). Hourly support is located at 1.0979 (26/07/2016 low). In the longer term, the technical structure favours a very long-term bearish bias as resistance at 1.1714 (24/08/2015 high) holds. The pair is trading in range since the start of 2015. Strong support is given at 1.0458 (16/03/2015 low). However, the current technical structure since last December implies a gradual increase.
GBP/USD has drifted out of the symmetrical triangle, negating relevance. Hourly resistance is located at 1.3291 (22/07/2016 high). Stronger resistance is located at 1.3534 (29/06/2016 high). Support located at 1.3058 (26/07/2016 low). The long-term technical pattern is negative and favours a further decline as long as prices remain below the resistance at 1.5340/64 (04/11/2015 low see also the 200-day moving average). Key support at 1.3503 (23/01/2009 low) has been broken and the road is wide open for further decline.
USD/JPY continues to retrace Tuesday's sharp decline. Monitor the hourly resistance at 106.45 Hourly supports can be found at 104.85 (intraday low). A key resistance area stands between 106.45 and 106.76. We favour a long-term bearish bias. Support is now given at 96.57 (10/08/2013 low). A gradual rise towards the major resistance at 135.15 (01/02/2002 high) seems absolutely unlikely. Expected to decline further support at 93.79 (13/06/2013 low).
USD/CHF continues to post higher lows, indicating a persistent short-term buying interest. However, given the resistance area between 0.9949 and 1.0328, the upside potential seems limited. Hourly support at 0.9910 (intraday low) and 0.9764 (14/07/2016 high). In the long-term, the pair is still trading in range since 2011 despite some turmoil when the SNB unpegged the CHF. Key support can be found 0.8986 (30/01/2015 low). The technical structure favours a long term bullish bias since last December.

