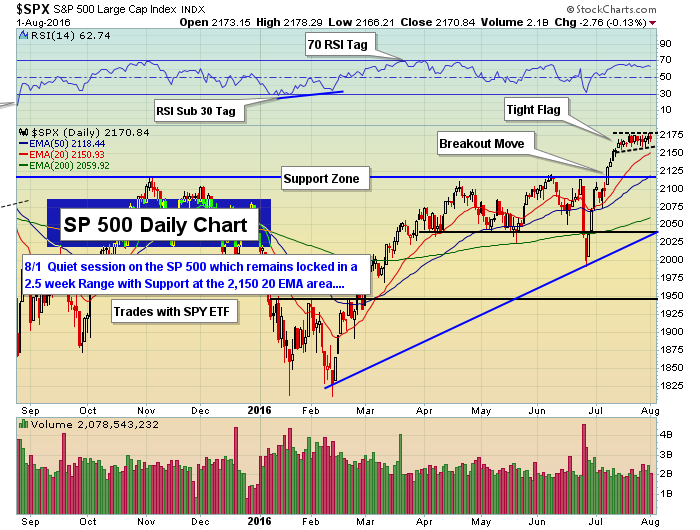
What other title fits this market so perfectly? None! Day after day we sit in this tiny 1% range on the S&P 500 between 2159 and 2177. It's approaching three full weeks. That's an incredibly long time to sit flat.
You can make arguments for both sides here. The bears are holding the line at 2175. The bulls are unwinding overbought charts. Who knows which one will win, but we need a break one way or the other as this is incredibly boring.
My concern for others is when things get boring, folks get emotional, and when folks get emotional, it's trouble. The more folks have to guess at the next move the more likely they are to make bad trades. We keep testing the breakout area, but come away empty handed. You wonder how long the bulls will deal with that before some semblance of giving up takes precedence.
Preference is for instant gratification. Bull markets force that type of mentality. The bulls are so used to getting everything they want. If you start taking away that reality they get upset and walk away. The bears have been bullied around for a very long time. Are they finally beginning to make some progress towards slowing this bull down? Could very well be, but they have to start by taking away the low in this flag at 2159. Then they would focus their attention on 2134.
So today was yet another day of teasing the bulls that they were about to enjoy yet another move high. It didn't happen. Back and forth to nowhere continues to be the way things are right now. Tomorrow we stare at day fourteen. It’s getting tough to spend any time watching this thing.
We all want action. We all want movement. I have no idea what the catalyst will be to get things moving above 2175 on a close or below 2159 on a close. Stay tuned. The boredom continues for now.
The much anticipated ISM Manufacturing report was out thirty minutes in to the trading day. The number wasn't horrendously below 50.0, but it was below expectations, and below last month’s reading. This after a poor GDP and durable goods report. Many will say it was a good number for the bulls since it wasn't hot, thus, Yellen won't think of raising rates. On the other hand, it wasn't so weak as to worry about a recession. Right in the middle, and, thus, just right.
The market must have news out there somewhere that will hit it down in a big way, but we haven't seen it yet. In normal times it has had plenty of bad news to fall on, but the Fed-controlled market is finding a way to take any piece of bad news and make it seem fine. Just the way it is and showing no signs of changing its stripes.
Maybe the jobs report on Friday will have some type of effect that'll move the market in a bigger way. The Fed watches this report very closely so it'll have an effect on things.
Bottom line is the market continues its ride up and down the 2159/2175-77 roller coaster. It is what it is. Big picture, as long as 2134 holds on the S&P 500 the trend remains higher, even though it is a grind. It’s not the type of breakout I had expected once we took out 2134. The breakout has been a disappointment. That said, we're still on breakout.
