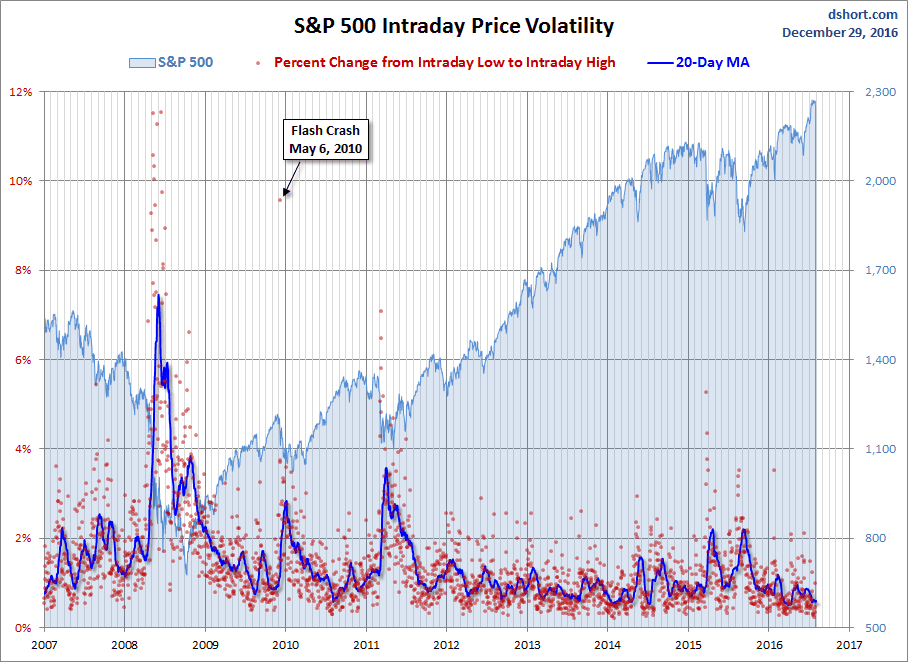
The S&P 500 made a half-hearted attempt to rally at the open, hitting its 0.20% intraday high ten minutes into the trade. It then sold off to its -0.24% intraday low early in the lunch hour. The index then spent two hours struggling back to the flat line, which proved resistance for the rest of the afternoon, closing with an essentially flat finish at -0.03%. What will Friday bring, the last market day of 2016? Stay tuned!
Here is a snapshot of the past five sessions.
The yield on the 10-year note closed at 2.49%, down two BPs from its previous close and the lowest close in ten sessions.
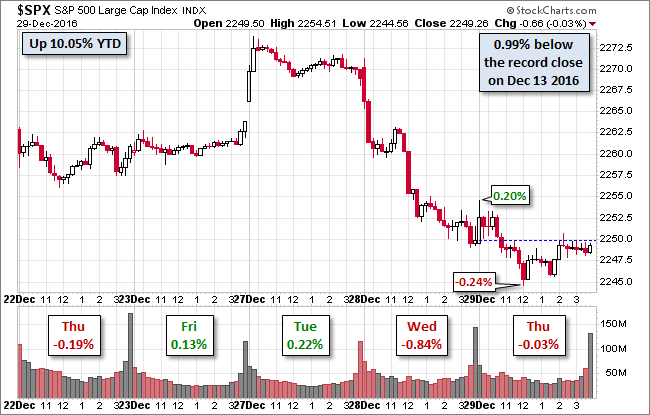
Here is daily chart of the index. Trading volume remains at light, year-end holiday levels.
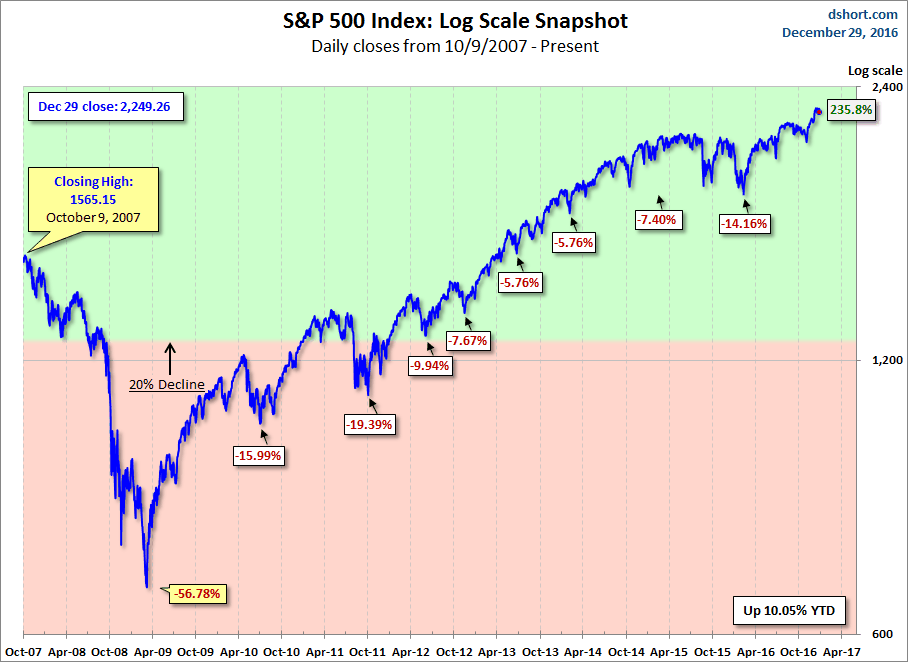
A Perspective on Drawdowns
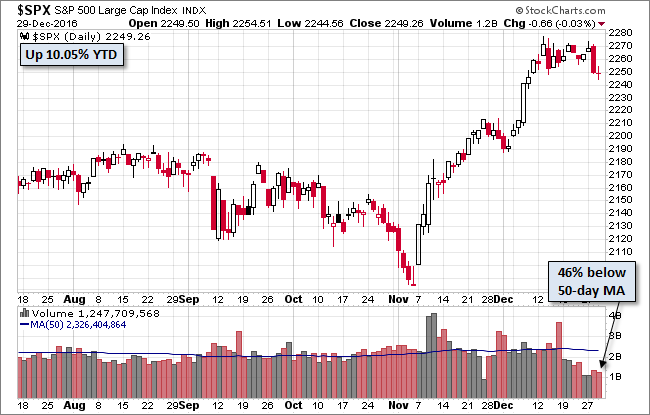
Here's a snapshot of selloffs since the 2009 trough.
Here is a more conventional log-scale chart with drawdowns highlighted.
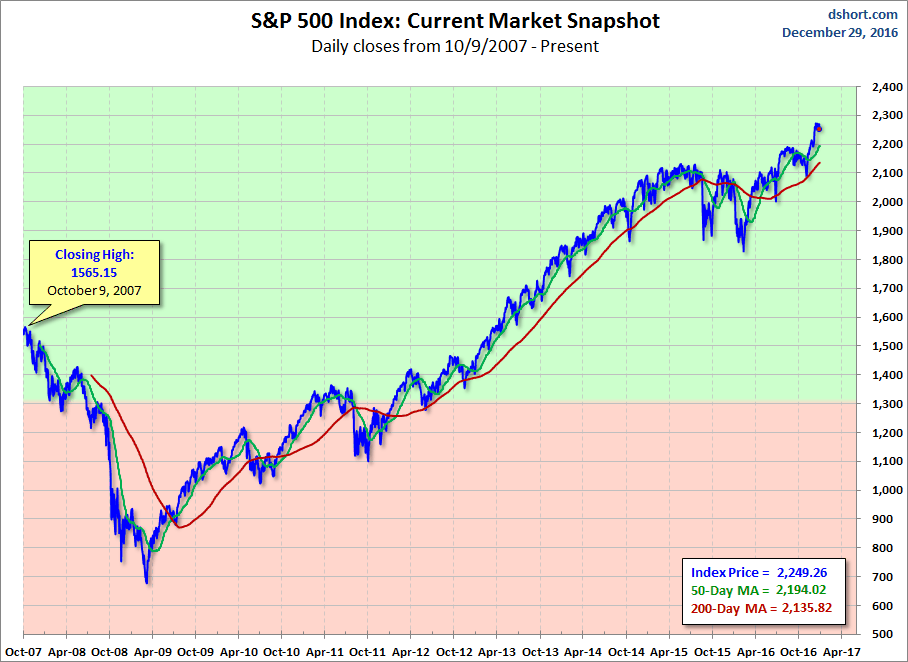
Here is a linear scale version of the same chart with the 50- and 200-day moving averages.
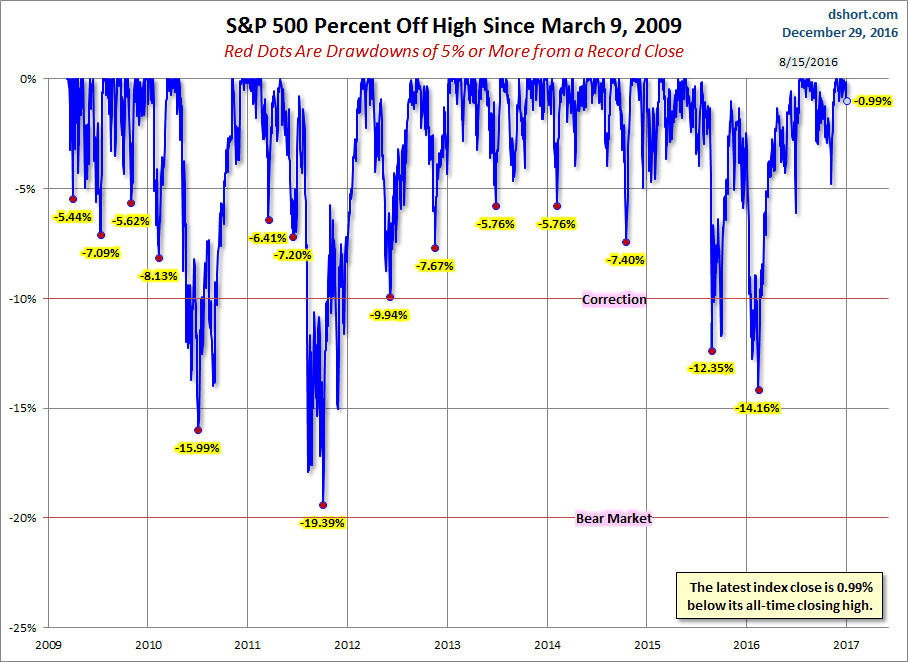
A Perspective on Volatility
For a sense of the correlation between the closing price and intraday volatility, the chart below overlays the S&P 500 since 2007 with the intraday price range. We've also included a 20-day moving average to help identify trends in volatility.
