Yesterday, the S&P 500 reached the 2600 mark for the first time in history. But the journey has not been a smooth one, especially in during the last month. On October 23rd, the index was trading near 2580. Then it fell to the low 2540s, before jumping to a new all-time high at 2596 on November 9th. And just as 2600 seemed to be in the bulls’ grasp, the bears returned to drag the SPX down to 2556 by November 15th. Only then it became possible for the buyers to finally reach the promised land of 2600.
Obviously, despite the new all-time highs, in the last month the S&P 500 did achieve a lot of progress. It has been zigging and zagging, moving up and down and probably annoying many breakout traders, who bought the new highs only to get discouraged by the following drop and close their long positions just when the next upswing was about to begin.
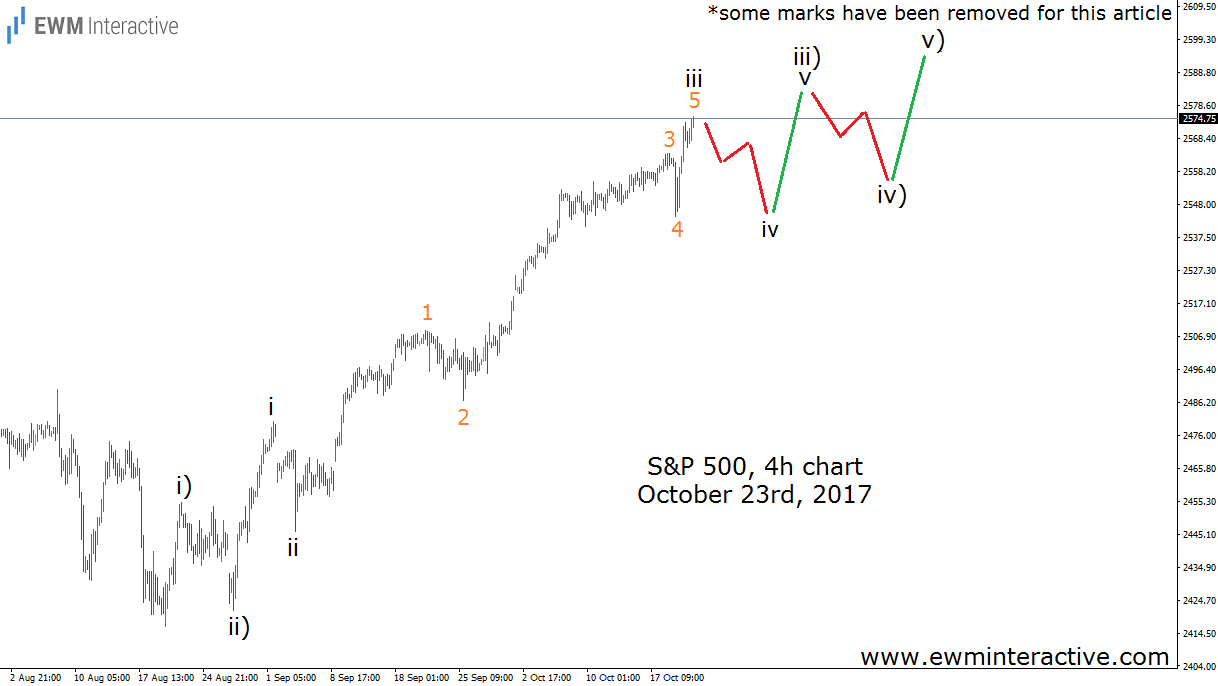
Elliott Wave analysts, on the other hand, do not care much about breakouts, because what is important to them is the wave structure of price action. So let’s see how the S&P 500 has been developing during the last month through the prism of the Elliott Wave Principle. The chart below, sent to clients before the market opened on Monday, October 23rd, shows that zigging, when the market zags is not impossible. Being just one step ahead of the market is more than enough.(some marks have been removed for this article)
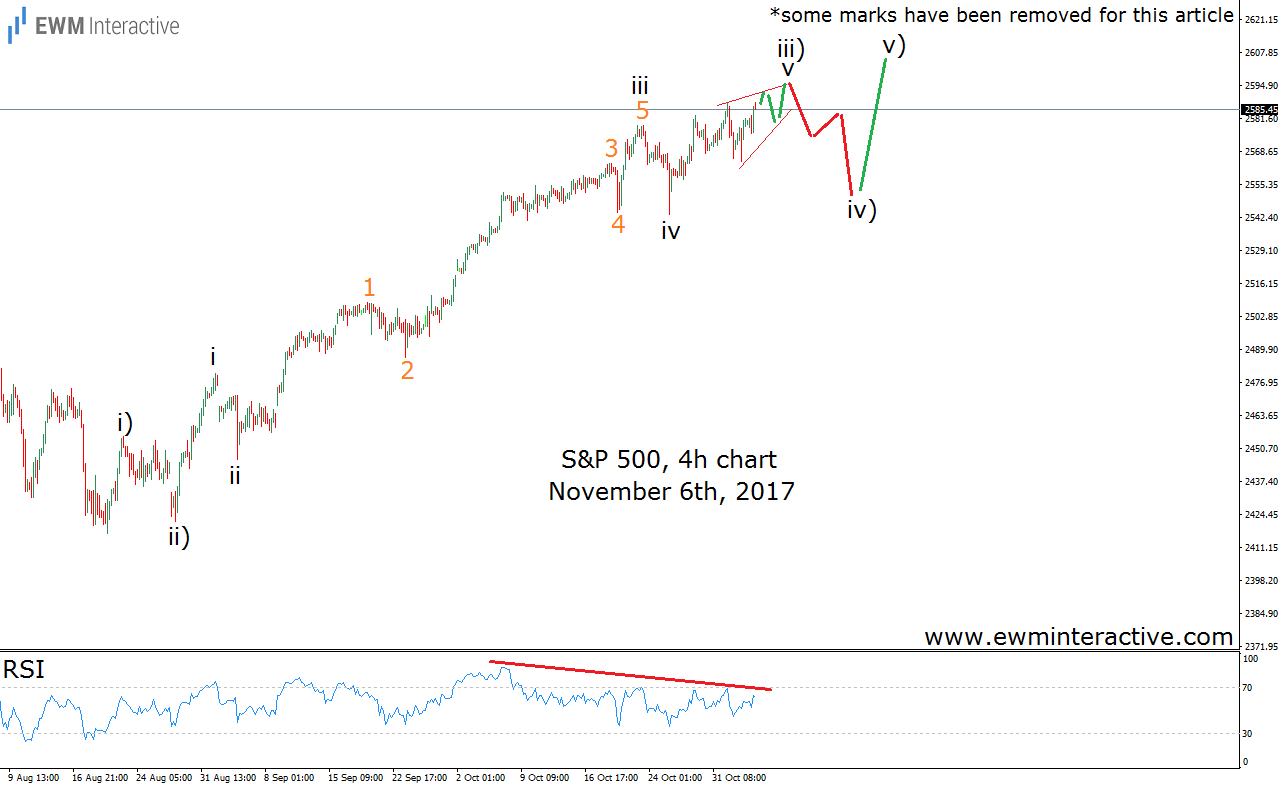
As visible, a month ago, while the S&P 500 was hovering near 2575, the wave structure of the entire rally from 2417 suggested a short-term pullback in wave iv should drag the price down to the support area of wave 4(orange) of wave iii, where buying opportunities would occur. Since the rally from 2417 was supposed to evolve into a five-wave impulse, we thought the S&P 500 was expected to move up and down in a series of fourth and fifth waves. That was a month ago. Two weeks ago, before the open on November 6th, the chart of the index looked like this:

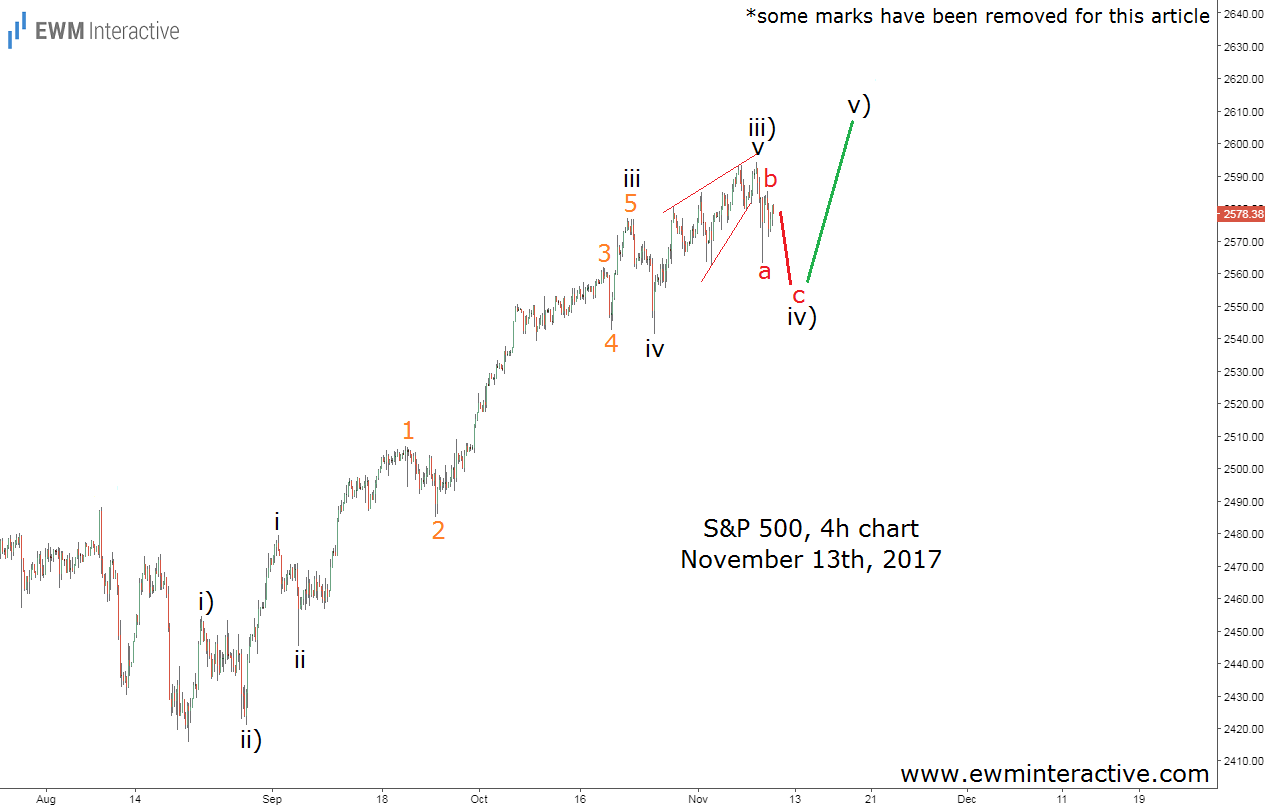
The pullback between 2579 and 2543 was the anticipated wave iv. As soon as the support of wave 4(orange) discouraged the bears, wave v of iii) up began. A few days later, the S&P had already reached a new high and it looked like wave “v” was developing as an ending diagonal. This, plus the bearish divergence shown by the relative strength index suggested wave iv) down was just around the corner. By Monday, November 13th, when we sent the analyses to subscribers, it was already in progress.

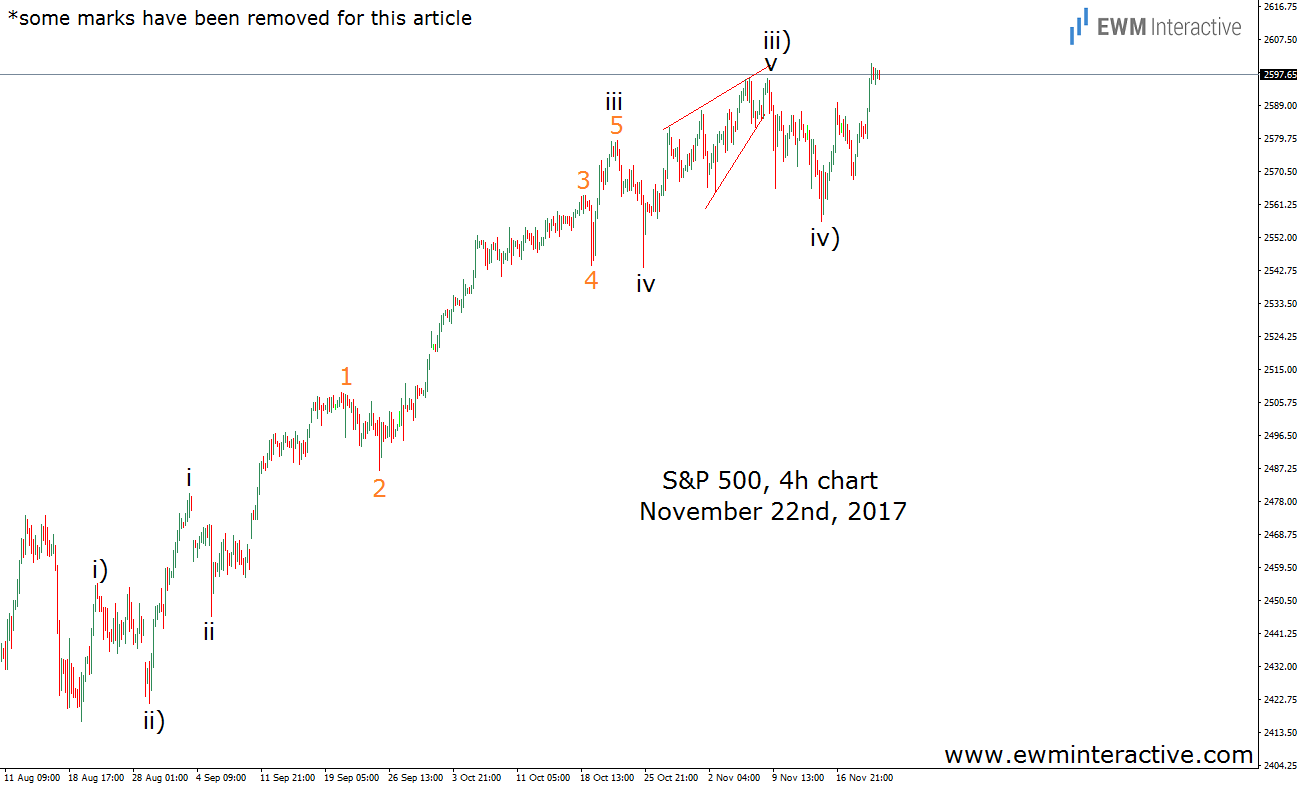
Wave v of iii) terminated at 2596, where the bulls made way for the next corrective decline in wave iv). As visible, the three-wave structure of wave iv) was not complete yet, so we thought that “buying opportunities should emerge near the support level at 2560”, where wave iv) was supposed to end and wave v) up to start. The chart below shows what happened next.

Wave iv) slightly breached the 2560 level. It bottomed out at 2556.50 and opened the door to 2600 in wave v). On November 21st, the bulls finally got there. Trading is less risky with the trend and more risky against it. The problem is that trends do not always offer a smooth ride. In this case, the S&P 500 was in an uptrend the whole time, but it did include several setbacks. Anticipating them helps traders keep a cool head, when they most need it. Which is always, by the way.
