🥇 First rule of investing? Know when to save! Up to 55% off InvestingPro before BLACK FRIDAYCLAIM SALE

Yen Pairs Test Key Support As ‘Phase One’ Sits On A Knife's Edge

Published 11/21/2019, 12:19 AM
USD/JPY
-
AUD/CAD
-
AUD/JPY
-
CAD/JPY
-
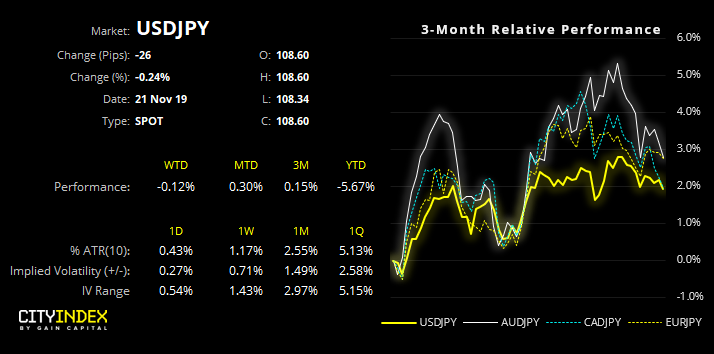
USD/JPY Chart

Whilst the constant stream of hot and cold trade headlines risk trade-tease fatigue among market participants (for which I am guilty as charged…), it’s possible we’re at an inflection point which could impact risk sentiment, one way or another.

A phase one deal is looking less and less likely and has all but been pushed back into next year. Trump has been quite vocal that he expects to get the deal he wants with China or the tariffs delays will be removed. So, reports today that China isn’t “stepping up” should be taken seriously as it indicates that the Chinese aren’t concerned with the tariffs, and are in no rush to sign the phase one trade deal Trump so desperately wants.

Add into the mix that Trump is considering signing the Hong Kong peace treaty (which China has condemned yesterday) and we have all the ingredients for the trade deal to fall apart whilst equities remains just off their record highs and JPY pairs are testing key lows.

We noted previously that several JPY pairs pointed towards a ‘risk reversal’, and the anticipated corrections have since come to fruition. Yet now we see that these corrections could turn into something more sinister if key support levels are broken. And perhaps a trade deal, or lack of could be the trigger.
USD/JPY Daily Chart

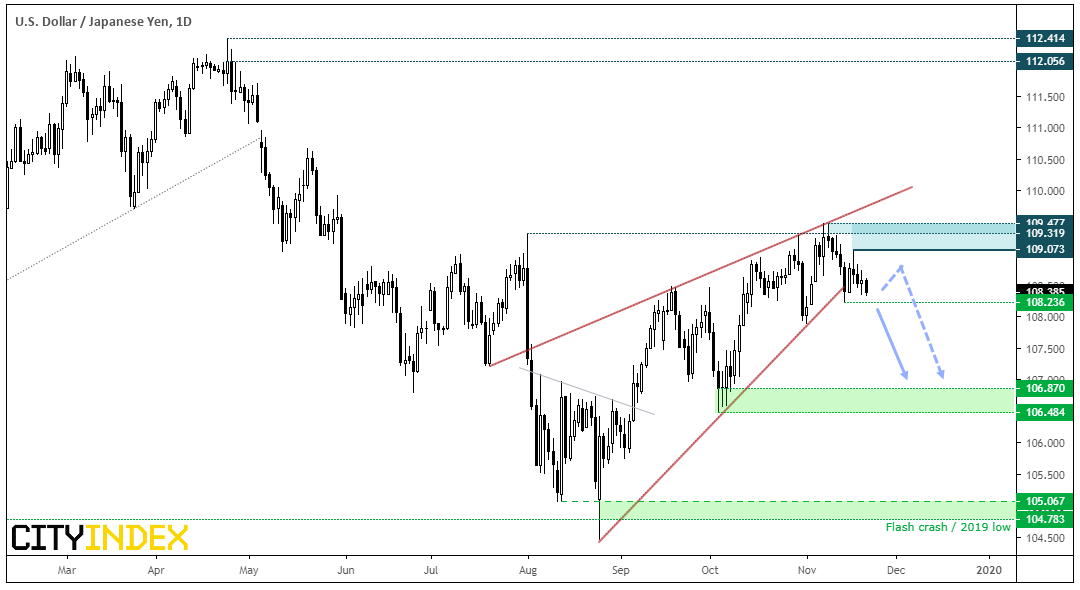
USD/JPY: The bearish wedge remains in play and a lower high has formed to suggest a change in trend is at least trying to occur. Yet we clearly need support to break with momentum (and likely soon) for this scenario to remain alive.
  • Near-term bias remains bearish below 109.07, although it would take a break above 109.48 to invalidate the bearish wedge.
  • A break below 108.23 assumes a run towards the base of the wedge around 104.50, although interim support levels near 106.50 and 108 can be used as bearish targets.
  • AUD/JPY Daily Chart

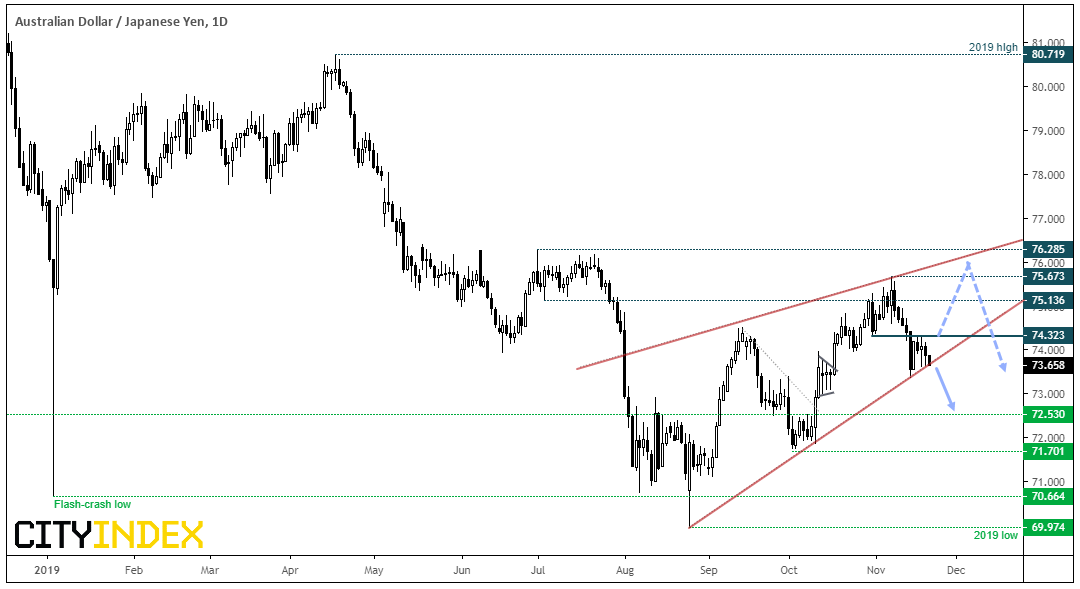
    AUD/JPY: There’s potential for a bearish wedge to form, although the pattern is still within its infancy so would require at least one more cycle higher. Besides, price action is already considering a break of the lower trendline and is clearly taking notice of resistance at 74.32.
  • Near-term bias remains bearish beneath 74.32.
  • A clear break of the trendline assumes and eventual run for the 2019 low, although interim support levels at 72.53, 71.70 and 71.66/71.00 can also be used as targets.
  • A break above 74.23 the bearish wedge is till forming, so we’d monitor prices to form another marginal high before turning lower once more. Therefore, a break above 74.32 would switch the bias to near-term bullish.
  • CAD/JPY Daily Chart

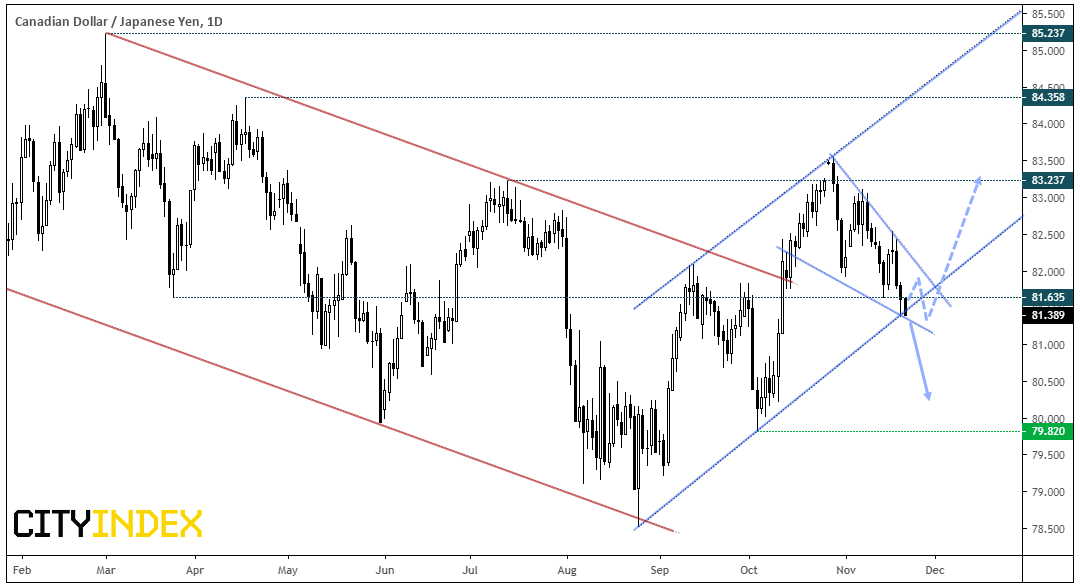
    CAD/JPY: The interesting thing with CAD/JPY is that it’s about to either confirm of invalidate two potential patterns; a bullish and a bullish channel. The bullish channel was flagged in prior analysis and perfectly marked the top of its rally through October, and price action is now testing the lower bounds of the bullish channel and bullish wedge.

  • Given the lack of news flow its possible prices may consolidate, yet keep in mind that JPY pairs are sensitive to trade developments (trade optimism would be bullish for xxx/JPY or bearish if talks sour)
  • Bias remains neutral until we see momentum invalidate or confirm either pattern.
    • However, we we’re bullish on AUD/CAD over the near-term, CAD/JPY could be the better short than AUD/JPY is we see broader JPY strength.

  • A clear break of yesterday’s low assumes a run towards 80.00.
  • TO consider bullish setups, we’d want to see bullish momentum hold within the bullish channel and break out of the bullish wedge. Under this scenario, bulls could target the base of the wedge around 83.50.
  • Original Post

    Latest comments

    Loading next article…
    Risk Disclosure: Trading in financial instruments and/or cryptocurrencies involves high risks including the risk of losing some, or all, of your investment amount, and may not be suitable for all investors. Prices of cryptocurrencies are extremely volatile and may be affected by external factors such as financial, regulatory or political events. Trading on margin increases the financial risks.
    Before deciding to trade in financial instrument or cryptocurrencies you should be fully informed of the risks and costs associated with trading the financial markets, carefully consider your investment objectives, level of experience, and risk appetite, and seek professional advice where needed.
    Fusion Media would like to remind you that the data contained in this website is not necessarily real-time nor accurate. The data and prices on the website are not necessarily provided by any market or exchange, but may be provided by market makers, and so prices may not be accurate and may differ from the actual price at any given market, meaning prices are indicative and not appropriate for trading purposes. Fusion Media and any provider of the data contained in this website will not accept liability for any loss or damage as a result of your trading, or your reliance on the information contained within this website.
    It is prohibited to use, store, reproduce, display, modify, transmit or distribute the data contained in this website without the explicit prior written permission of Fusion Media and/or the data provider. All intellectual property rights are reserved by the providers and/or the exchange providing the data contained in this website.
    Fusion Media may be compensated by the advertisers that appear on the website, based on your interaction with the advertisements or advertisers.
    © 2007-2024 - Fusion Media Limited. All Rights Reserved.