- Monitoring purposes SPX: Covered short at 2182.87 = .63% loss; Short SPX on 7/26/16 at 2169.18.
- Monitoring purposes Gold: GDX on 6/10/16 at 25.96 = gain 14.97%. Long GDX on 5/31/16 at 22.58.
- Long-Term Trend monitor purposes: Short SPX on 1/13/16 at 1890.28

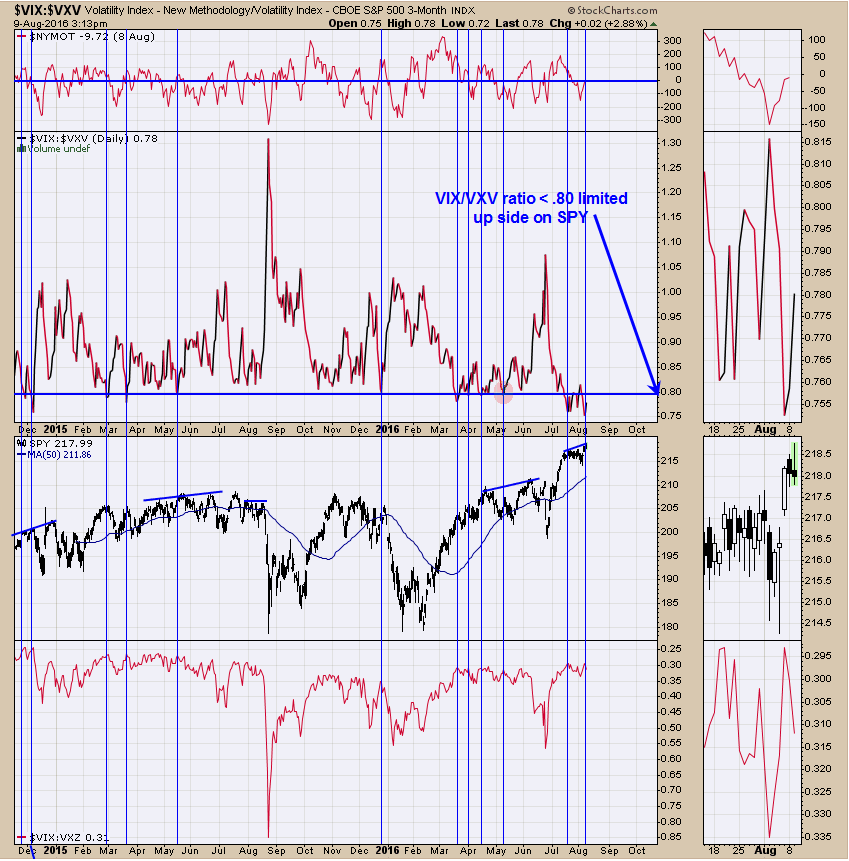
The chart above is the VIX--VXV ratio. When this ratio is .80 or less than upside is usually limited on the SPX. In general this ratio has been below .80 since mid July and the SPY is in with a percent of the July high. Therefore market upside appears limited. Page two shows an indicator that shows a limited downside for the SPY. In conclusion, market may become quieter than it is currently experiencing. Market tops form when market is quiet.

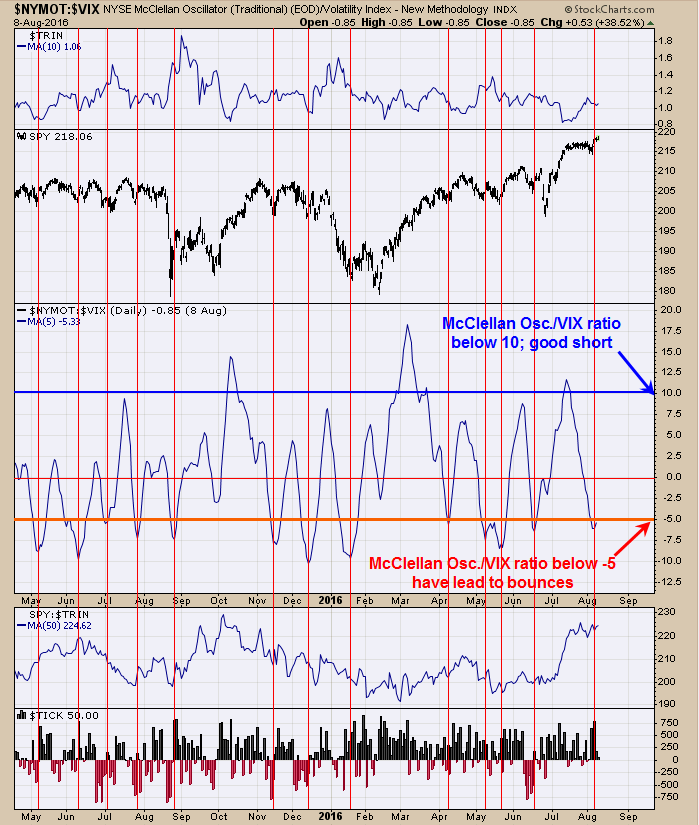
We don’t see the rally continuing as the upside appears limited but market could stabilize short term. The middle window in the above chart is the NYSE McClellan oscillator/VIX ratio. We showed this chart yesterday and we fined tuned the parameters. It appears that a reading of -5.00 works better than a -6.00 for bottom signals. This ratio produces the best shorting opportunities with readings below +10.00 and above “0”. When this ratio gets above +12.50 it suggests the rally will continue. As it stands now this ratio is not setup for the market to have a worthwhile decline to begin here. If this ratio rises back above “0” than turns down could lead to a decent decline for the SPX.

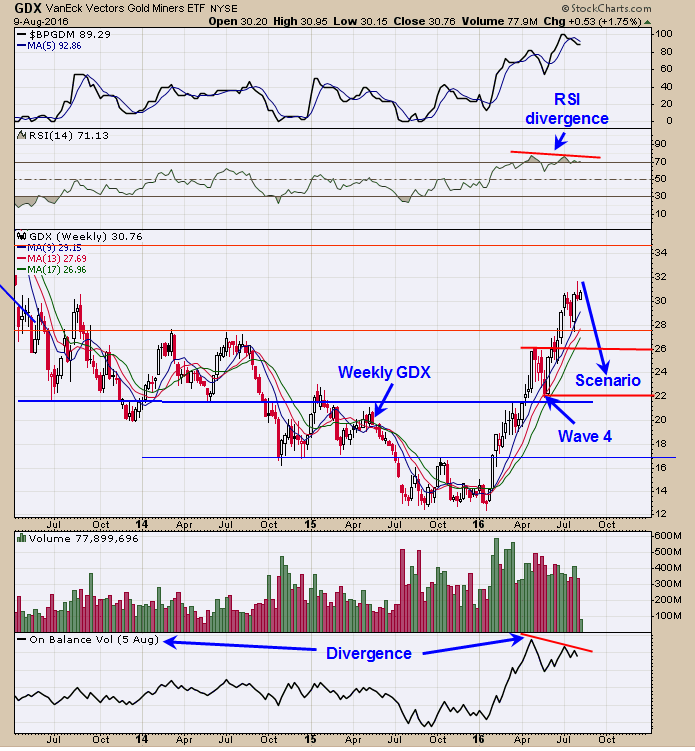
Above is the weekly GDX chart. An Elliott Wave five count up from the January low may be completing or is complete and a pull back to the previous Wave 4 is possible in the coming weeks. We have a price range for the next possible low in GDX form 26.00 down to 22.00 range. Once the pull back is complete, another rally on GDX to new high is expected. The ideal time for the next low in GDX is the October, November timeframe. We are looking for evidence that the rally from the January low is complete and its starting to look like Wave 5 is complete or nearly complete. We are watching closely for a bearish setup on GDX. Sold GDX on 6/10/16 at 25.96 = Gain 14.97%.
Signals are provided as general information only and are not investment recommendations. You are responsible for your own investment decisions. Past performance does not guarantee future performance. Opinions are based on historical research and data believed reliable, there is no guarantee results will be profitable. Not responsible for errors or omissions. I may invest in the vehicles mentioned above. Copyright 1996-2016.
