The Financial Select Sector SPDR (NYSE:XLF)
The Q2 earnings season, which officially kicks off on Monday July 11, 2016 with Alcoa's (NYSE:AA) earnings report and releases from a host of major banks later in the week, comes after four back-to-back quarters of earnings declines for the S&P 500 index. This negative growth trend is not expected to reverse this reporting season either, with Q2 earnings growth expected to be in the negative; the longest run of earnings declines for the index since the 2008 financial crisis.
Keep in mind, however, that the Q2 earnings season has actually gotten underway already, with results from 23 S&P 500 already on the books. All of these early reporters, which includes industry leaders like Pepsi (PEP), FedEx (NYSE:FDX), Nike (NKE), and others, have fiscal quarters ending in May that get counted as part of the June quarter tally.
Total earnings for these 23 index members are down -2.0% from the same period last year on +0.8% gain in revenues, with 65.2% beating EPS estimates and 47.8% coming ahead of top-line expectations. This is a weak showing from this group of 23 index members relative to what we have seen from them in other recent quarters, but it’s likely premature to extrapolate that comparison to the coming earnings releases.
Estimates Looking Forward
Total earnings for the S&P 500 index are currently expected to be down -6.2% from the same period last year on -0.7% lower revenues, with earnings growth expected to be in the negative for 9 of the 16 Zacks sectors. The Energy sector continues to be the big drag, but Q2 earnings growth for the index would still be in the negative even on an ex-Energy basis.
The chart below shows Q2 growth expectations contrasted with what was actually achieved in the preceding three quarters and estimates for the following four periods. Full-year 2016 earnings growth expectations have now turned negative, similar to what we saw last year.-Zacks.com
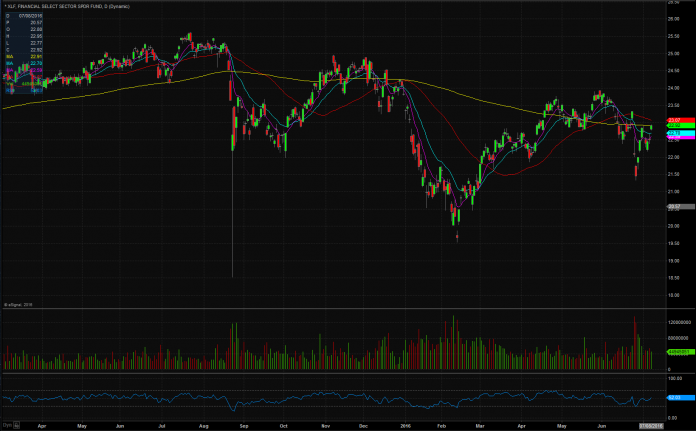
XLF (Financials ETF) Chart
Above is the XLF (financials ETF) chart which constitutes many of the major (large-cap stocks) and medium-(midcap stocks) banking stocks which are listed on the New York Stock Exchange and the Nasdaq Stock Market Exchanges. The red circles show the major areas of levels of resistance with trend lines that indicate heavy sellers and a down-trend that seems to be getting more ugly as time has been going on as of this writing.
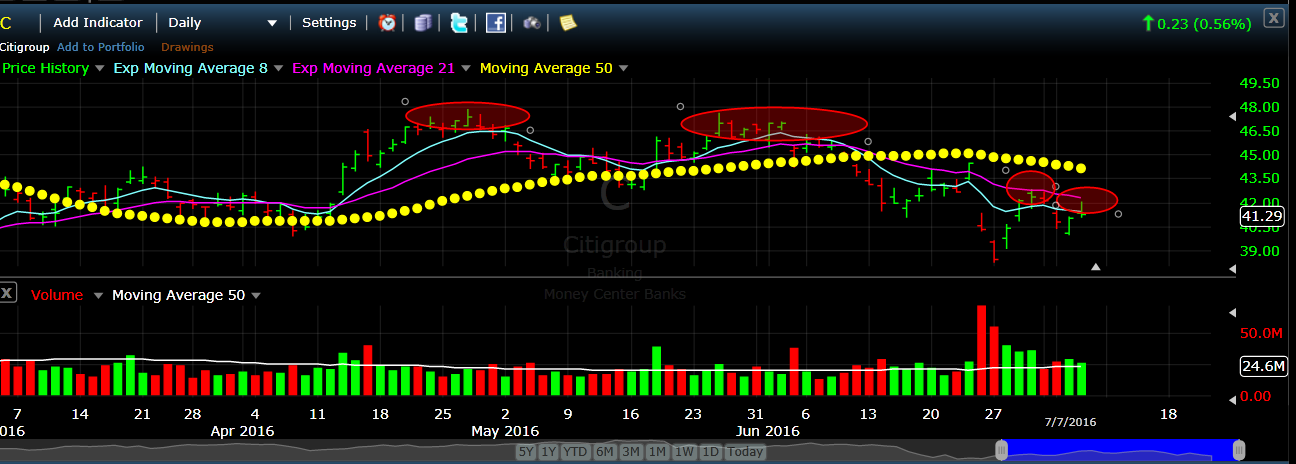
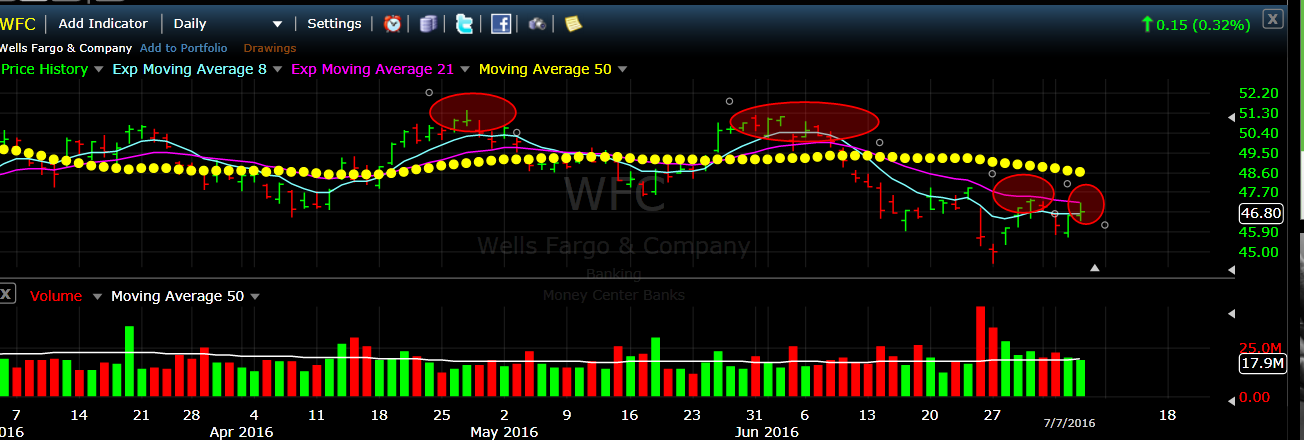
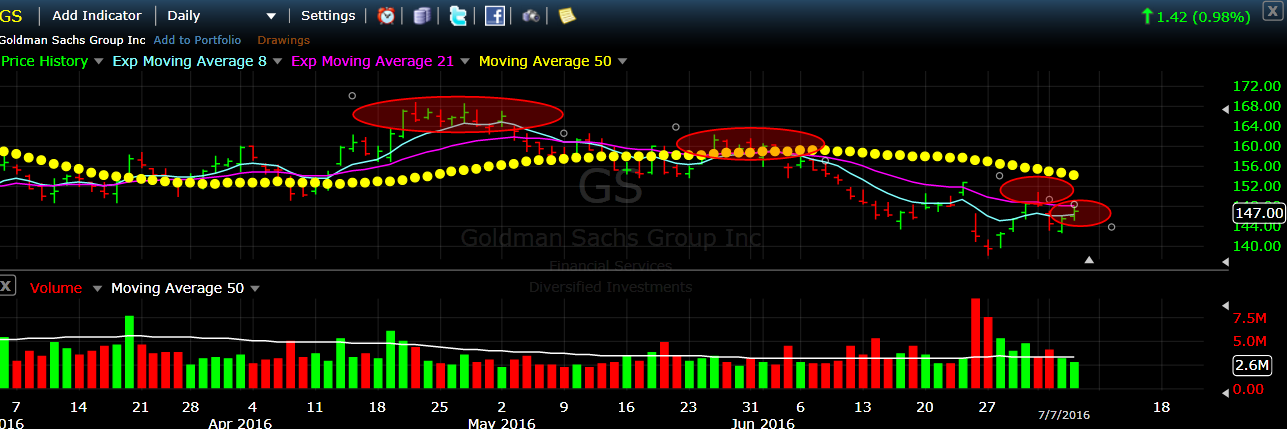
Banking Financials Charts
Above is the Citigroup Inc (NYSE:C) chart showing the red circles of resistance levels- portending lower prices.
Above is the Wells Fargo & Company (NYSE:WFC) chart. Note- same areas of red resistance noted.
Above is the Goldman Sachs Group Inc. (NYSE:GS:NYSE). The behemoth of U.S. Financial Companies chart bestowing yet the same red resistance levels. Clearly this seems to be an ominous picture for the overall U.S. Financial stock price outlook.
(XLF) ETF Profile
The investment seeks investment results that, before expenses, correspond to the price and yield performance of publicly traded equity securities of companies in the Financial Select Sector Index. In seeking to track the performance of the index, the fund employs a replication strategy. It generally invests substantially all, but at least 95%, of its total assets in the securities comprising the index. The index includes companies from the following industries: diversified financial services; insurance; commercial banks; capital markets; REITs; consumer finance; thrifts & mortgage finance; and real estate management & development. The fund is non-diversified.


