
Decline in global GDP rate and correction of global stock indexes make up favorable environment for gold
Gold futures are up above $1230 per ounce due to the talks about a slowdown in the expansion of global economy and the Fed’s monetary normalization, drop in the oil prices and the US stocks, the US dollar challenge, resulted from a possible revising the US GDP down for the third quarter and the dovish rhetoric of the November FOMC meeting’s minutes. The precious metal is growing stronger amid a decline in global risk appetite and the Brent drop below $60 per barrel. The XAUUSD bulls are also supported by the S&P 500 slide to the red zone since the start of the year.
Oil prices are traditionally seen as a kind of indicator for global economy’s state; therefore, the crash of Brent and WTI in the October-November period became the further evidence that global GDP growth has reached its peak in 2018. However, there are no reasons for panic: economic expansion is likely to continue, though, at a slower pace.
Along with the Fed’s monetary restriction, higher borrowing costs and the dollar revaluation, the sales in the US stock market were triggered by talks that the US economy is losing its speed and the corporate income is going down. Investors are based on the principle of “it is too early to by stocks and too late to buy bonds”. Therefore, they have spare money, and a part of it is invested into the gold market. The evidence that the cashing out becomes more popular is the fact that the yield on 3-month Treasury bills exceeds the Barclays global aggregate bond index. It has been the first time since ultra-low interest rates started that money means are getting more competitive than bonds.
Dynamics of Gold and S&P 500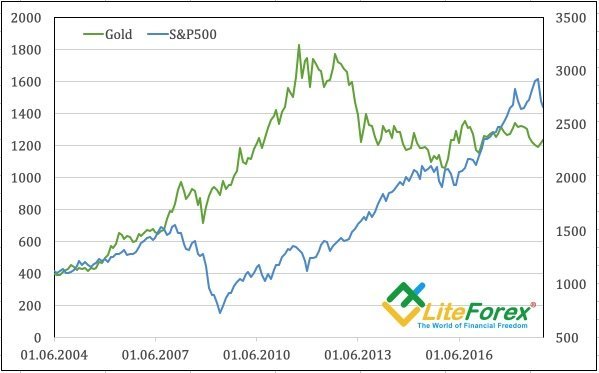
Source: Reuters
Yields on 3-month US Treasury bills and Barclays (LON:BARC) global aggregate bond index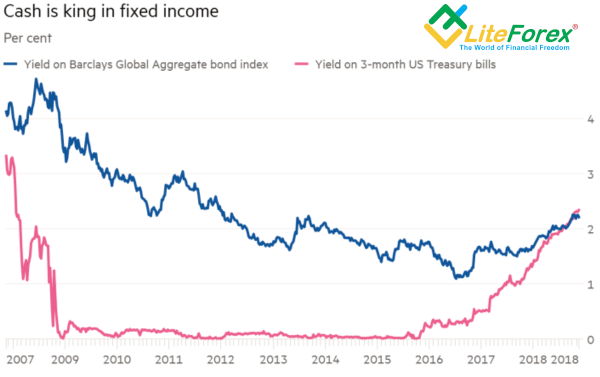
Source: Financial Times
However, investors shouldn’t be too much concerned about the S&P 500 correction. Although it has been in the red zone since 2018, the index has been about 25% during the last two years. The number of days when it was going up or down by 1% is close to the average for the past six decades, it is 53. In 2017, there were only eight such days. It is not natural and resulted from the influence of the Fed’s ultra-easy monetary policy on the financial markets. Therefore, even based on the assumption that S&P 500 and global GDP have reached their growth peaks in 2018, I don’t think there will be a soon recession of the US economy, let alone global economy. I suggest the gold has survived through the hard times, and the trend for the precious metal is clear. However, it is not likely to grow as fast as the XAUUSD bulls would like.
It should be understood that the way up is always hard; however, once the price direction is clear, one can apply the previously suggested strategies to buy Gold on the price fall as much as they wish. If the US economy doesn’t perform so well as it seems to, and the Fed slows down normalizing its monetary policy, the gold price can well be up as high as $1250-$1255 till the end of 2018.