Markets are breaking the rules and it is mostly due to various forms of intervention (opinion). Crude oil prices firmed up on news of tighter than expected inventories, but it was also helped along by comments from a prominent OPEC member suggesting the phase of lower oil prices is over. Similarly, the equity markets are being propped up on hopes of stagnant Fed policy in December (and November of course) and expectations of a Clinton victory (which is "comfortable" for market participants adverse to uncertainty).
It feels like each of the factors keeping stocks afloat are based on ideas rather than concrete fundamentals. Further, these things can change in the blink of an eye. For example, firm trade in crude oil helped to prop equities up today but after crude oil printed at levels not seen in over a year buying dried up. We could easily see sellers come into the oil market which would act as a weight on the S&P.
Treasury Futures Markets
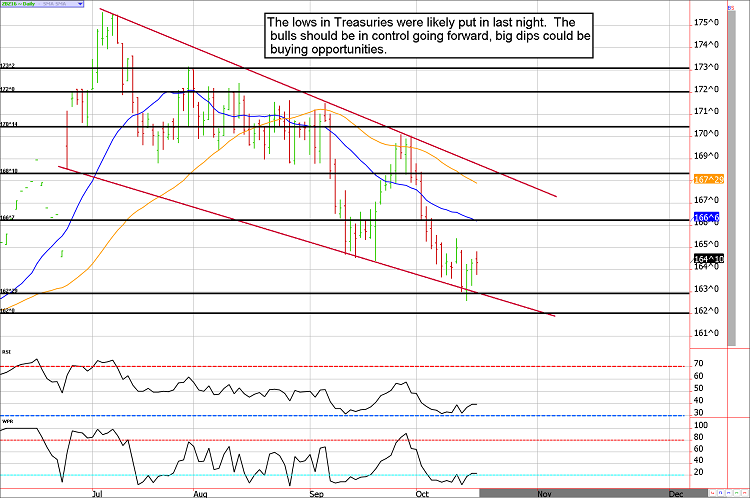
We can't think of many reasons to be bearish Treasuries.
We've gone through our checklist of analysis tools, and aside from a relatively neutral COT report we cannot find any reason not to be bullish the Treasury market. Seasonals are overall supportive through December, the market has tested and held trendline support, yields have become relatively attractive to investors, and the stock market seems to be on shaky ground. Accordingly, we suspect there will be some interested buyers in the coming weeks.
The 30-year bond has posted a convincing key-reversal. If we are right bout the bulls taking control, this rally should find its way toward 168. In the meantime, there will be some resistance in the mid-166 area.
Treasury Futures Market Analysis
**Bond Futures Market Consensus:** We think Treasuries have reversed, getting bullish on big dips is likely the way to play.
**Technical Support:** ZB : 162'29, 162'0 and 158'30 ZN: 129'11 and 128'23
**Technical Resistance:** ZB: 166'22, 168'10, and 170'14. ZN: 130'21, 131'21, 132'02, and 133'14
Stock Index Futures
Monday was shaky, but Tuesday and Wednesday were firm
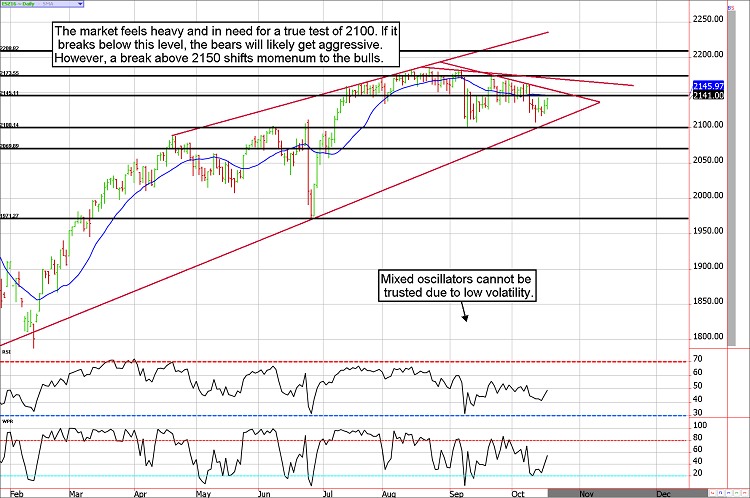
We are generally optimistic people who expect the equity markets to move higher over time. However, a market sitting near all time highs and flashing tell-tale signs of a reversal have caused us to be skeptical in recent months. As we've been painfully reminded with each market bounce, this is still a bull market...and we've been wrong thus far about looming weakness.
Taking that a step further, this is not the average bull market. It has defied seasonal tendencies. It has weathered a handful of technical failures, it has hovered near all-time highs for months, and it has consistently rewarded the dip buyers. In our opinion, these are signs of an impressive, yet unhealthy, market. It doesn't resemble anything we've ever seen before and has pushed us out of our comfort zone. We've always said: when in doubt stay out.
The best trade might be the least risky. If the ES tests triangle resistance near 2150/2155 it might be worth considering the purchase of cheap put options. After all, volatility is low and options are cheap!
Stock Index Futures Market Ideas
**e-mini S&P Futures Market Consensus:**
The risk of being long and wrong is substantial, make sure bullish positions are well hedged. A break below 2100 would be significant. In the meantime, look for resistance near 2150/2155. Buy cheap puts?
**Technical Support:** 2102 and 2070
**Technical Resistance:** 2155, 2173, 2195, 2215, and 2230
e-mini S&P Futures Day Trading Ideas
**These are counter-trend entry ideas, the more distant the level the more reliable but the less likely to get filled**
ES Day Trade Sell Levels: 2141, 2165, 2173, and 2191
ES Day Trade Buy Levels: 2125 (minor), 2117, 2100, and 2070
In other commodity futures and options markets....
June 23 - Go long corn futures near 392 using mini contracts (the beginning of a scale trade). Full-sized contracts can be used if available margin and risk tolerance is appropriate.
June 30 - Buy September mini (or full-sized) wheat near $4.47.
July 5 - Add to the long mini corn (or full sized) near $3.45.
July 14 - Sell the corn add-on near 370 to lock in a profit (hold the original entry).
July 29 - Buy mini corn future near $3.33 to average entry cost lower.
July 29 - Buy mini wheat to add to our long and adjust the average position entry to $4.25ish.
August 18 - Sell half of the mini wheat position to lock in a profit of about 20 cents on the add-on contract. We'll hold the original position in hopes of a continued upswing.
August 29 - Sell December live cattle 99 put for about 140 (or $560).
September 14 - Buy the January soybean 10.60 calls for about $300.
September 20 - Sell the January soybean 10.60 calls for about 15 cents to take a quick profit.
September 30 - Buy the January soybean 10.60 call for 6 cents (again).
September 30 - Sell the December Fed funds futures contract near 99.52.
October 6 - Buy March Euro strangles using the 123 calls and the 100 puts for about $400. This trade is looking for a sharp increase in volatility.
October 11 - Sell January crude oil $61 calls for about 46 cents.
October 19 - Buy back December cattle 99 put, sell 2 92 puts and 1 106 call to replace it. this slows the trade down and spreads risk away from the current market price.
(Our clients receive short option trading ideas in other markets such as gold, crude oil, corn, soybeans, Euro, Yen, and more. Email us for more information)
Disclaimer: There is substantial risk of loss in trading futures and options. These recommendations are a solicitation for entering into derivatives transactions. All known news and events have already been factored into the price of the underlying derivatives discussed. From time to time persons affiliated with Zaner, or its associated companies, may have positions in recommended and other derivatives. Past performance is not indicative of future results. The information and data in this report were obtained from sources considered reliable. Their accuracy or completeness is not guaranteed. Any decision to purchase or sell as a result of the opinions expressed in this report will be the full responsibility of the person authorizing such transaction. Seasonal tendencies are a composite of some of the more consistent commodity futures seasonals that have occurred over the past 15 or more years. There are usually underlying, fundamental circumstances that occur annually that tend to cause the futures markets to react in a similar directional manner during a certain calendar year. While seasonal trends may potentially impact supply and demand in certain commodities, seasonal aspects of supply and demand have been factored into futures and options market pricing. Even if a seasonal tendency occurs in the future, it may not result in a profitable transaction as fees and the timing of the entry and liquidation may impact on the results. No representation is being made that any account has in the past, or will in the future, achieve profits using these recommendations. No representation is being made that price patterns will recur in the future.
