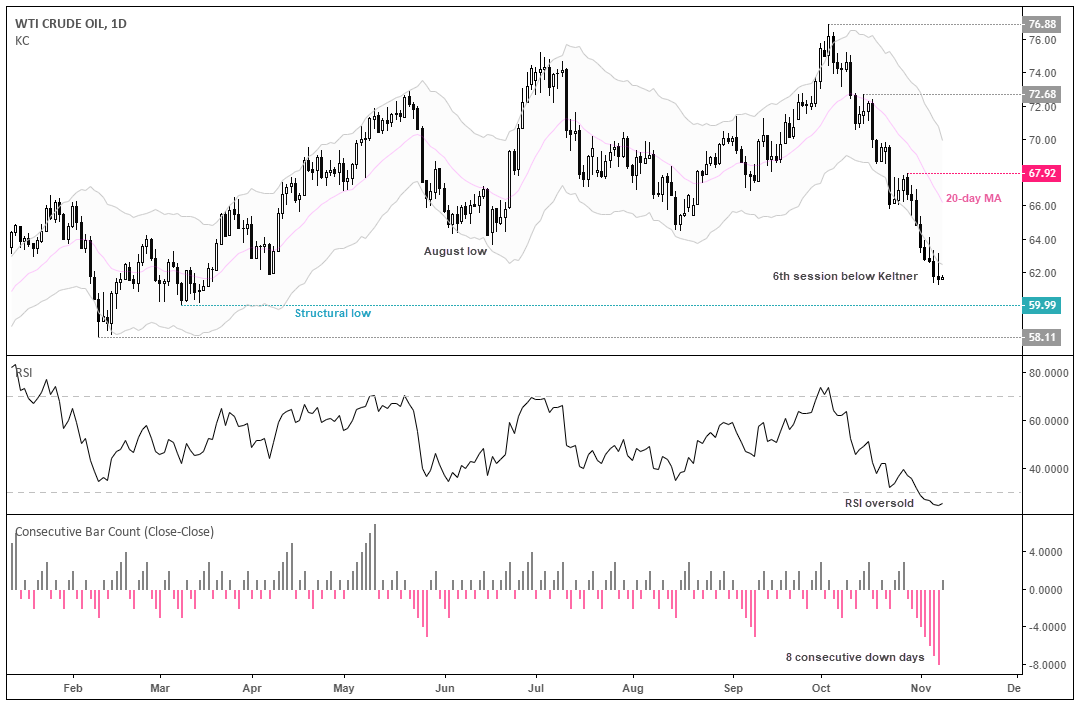
Since its sell-off from multi-year highs, WTI is within its most bearish 5-week run since January 2016. And whilst momentum favours a test of $60, the risk of a retracement from current levels appears high.
Starting with the daily chart, we note that momentum is clearly bearish and minor retracements since the 76.88 high denote a powerful downtrend. However, RSI has been oversold all month, it’s on its sixth session beneath the lower Keltner band and the tall upper wicks of the prior three sessions show bulls starting to put up a fight. Furthermore, WTI has traded lower for 8 consecutive sessions (on a close-to close basis) which historically has led to mean reversion.

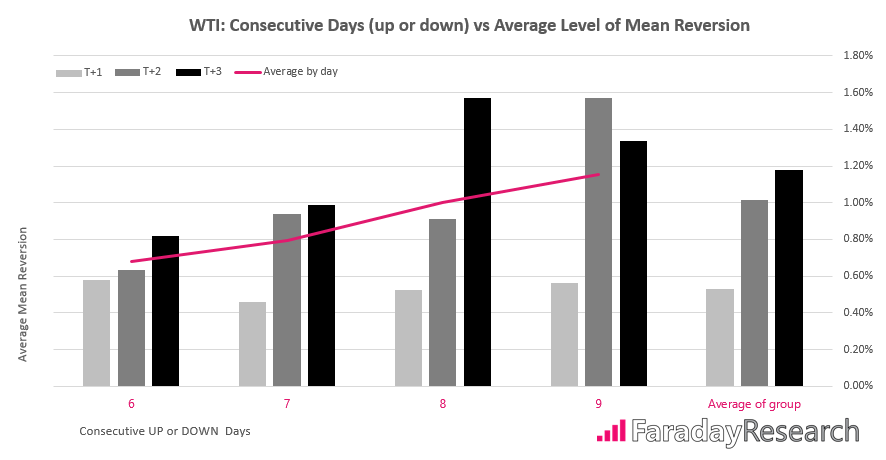
We analysed consecutive runs to measure their tendency to mean revert. As there have only been 14 occurrences of 8 down days (0.16% of all data) we combined up and down days to measure their typical levels of mean reversion, regardless of direction. Taking this approach increased the sample size from 14 to 32, with the overall average now accounting for 145 data points. Encouragingly we saw that, on average, mean reversion tends to occur following consecutive runs between 6-9 days in the same direction.

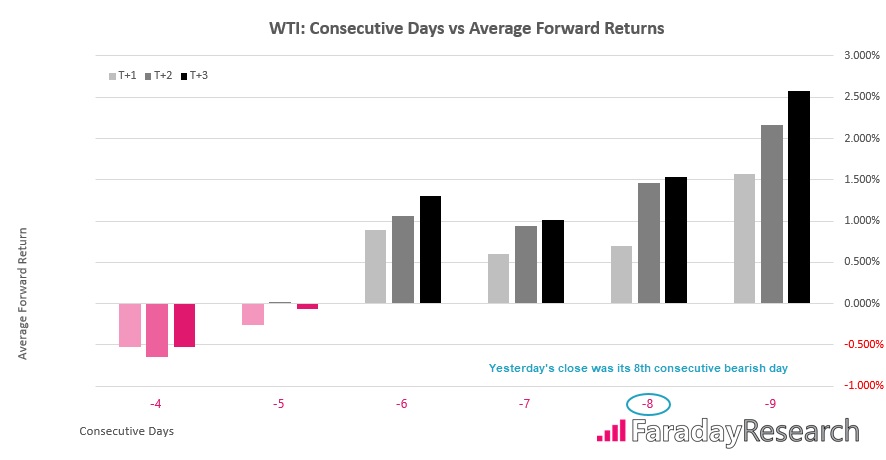
Furthermore, the level of mean reversion tends to rise alongside the length of the preceding run looking at the ‘average by day’. That said, as mean reversion tends to be the highest on T+3 it also suggests it may not be an excellent timing tool (to the day at least) but it does appear to provide a decent warning. For the sake of completeness, below shows the average forward returns following 8 consecutive down days, which also shows mean reversion.

Given the consecutive run of down days and warning signals from the chart, we think the odds of a retracement are high and WTI is in some need of mean reversion. As the trend remains bearish below 67.92, we’re waiting for prices to retrace and consolidate somewhere beneath this key level before considering a short trade. The August lows or 20-day average may provide resistance going forward and hopefully provide a better reward to risk ratio for a short back towards $60.
Which stock should you buy in your very next trade?
AI computing powers are changing the stock market. Investing.com's ProPicks AI includes 6 winning stock portfolios chosen by our advanced AI. In 2024 alone, ProPicks AI identified 2 stocks that surged over 150%, 4 additional stocks that leaped over 30%, and 3 more that climbed over 25%. Which stock will be the next to soar?
Unlock ProPicks AI