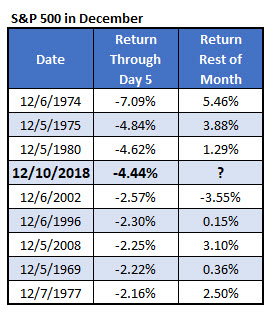
December -- a historically bullish month -- started out rough for U.S. stocks, amid mixed signals on U.S.-China trade relations, concerns about bond yields and oil prices, and a high-profile arrest, just to name a few reasons. In fact, the S&P 500 Index (SPX) was down 4.44% as of yesterday's close, which marked the fifth trading session of the month, since Wall Street was shuttered last Wednesday, Dec. 5, to mourn President George H.W. Bush. That marks the worst December start for the stock market in decades.
Since 1950, there have been just eight other times when the SPX was down at least 2% in the first five sessions of December, per Schaeffer's Senior Quantitative Analyst Rocky White. The last time was 10 years ago, in December 2008, when the index was down 2.25% and U.S. stocks were in the throes of the financial crisis. This year's start marks the worst since December 1980. For context, December has historically been the best month of the year, looking at returns since 1950, with the index averaging a gain of 1.61%, and higher 75% of the time.

However, as you can see on the chart above, the SPX went on to enjoy positive rest-of-month returns every time but once, back in December 2002. Even in December 2008, the index posted a 3.1% return the rest of the month.
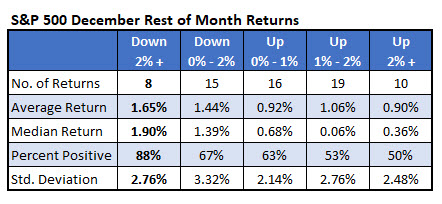
In fact, the worse December begins for stocks, the better it seems to end. Below you'll find S&P 500 December stats based on performance during the first five trading sessions. When the stock market barometer is down 2% or more, as it is now, it's went on to average a rest-of-month return of 1.65%, and was higher 88% of the time. That's much better than the other scenarios. For instance, when the index was up 2% or more to start the month, it averaged a rest-of-December gain of 0.9%, and was higher just 50% of the time.

In conclusion, bulls shouldn't give up hope for a Santa Claus rally. Bad starts to December typically end up resolving to the upside, not to mention the second half of the month has been the best time to own stocks, historically. From a technical standpoint, though, traders should watch the S&P's movement between the 2,600 and 2,800 levels for clues to future price action, per Schaeffer's Senior V.P. of Research Todd Salamone.
