If you missed my presentation this afternoon you can watch the replay here.
MACRO
Stocks rose on October 9. Today was in hopes of a trade deal. Yesterday those hopes were dimming; today, they were brightening — whatever, who cares. Let’s look at the chart; it is bound to be more informative.
S&P 500 (SPY (NYSE:SPY))
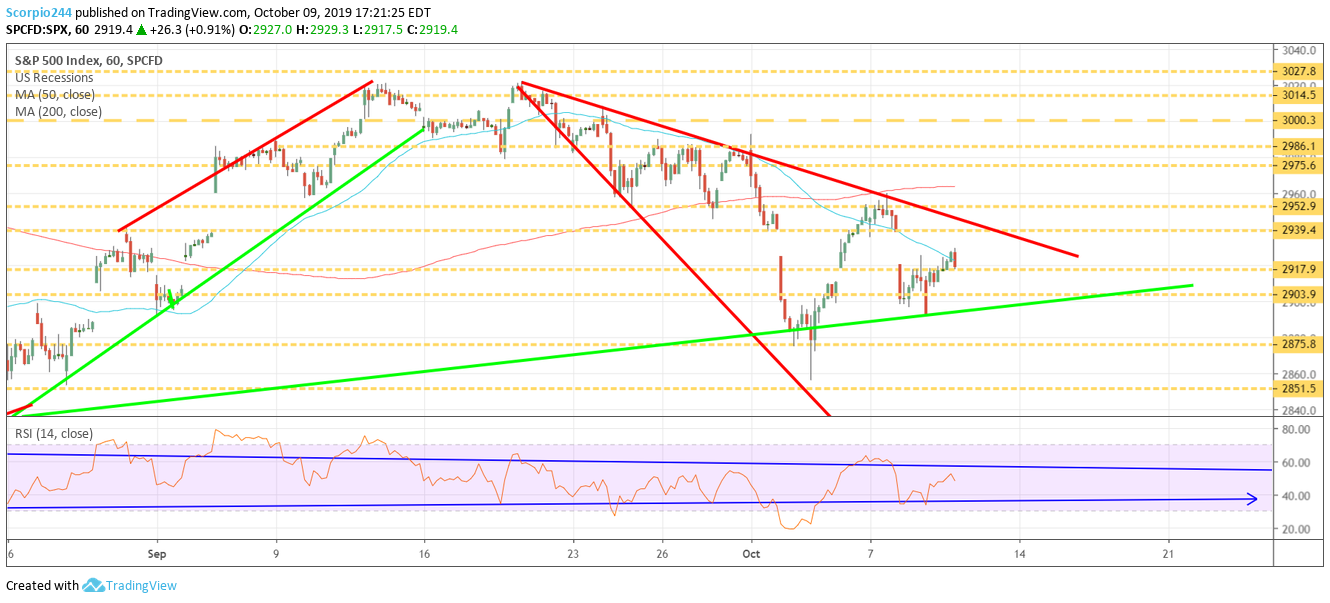
The general direction in the chart is higher, and there is still that gap left to fill up to 2940. My gut says the S&P 500 rises to that level of resistance. That is also where the downtrend lives. To say that 2940 is a crucial region of resistance is an understatement.
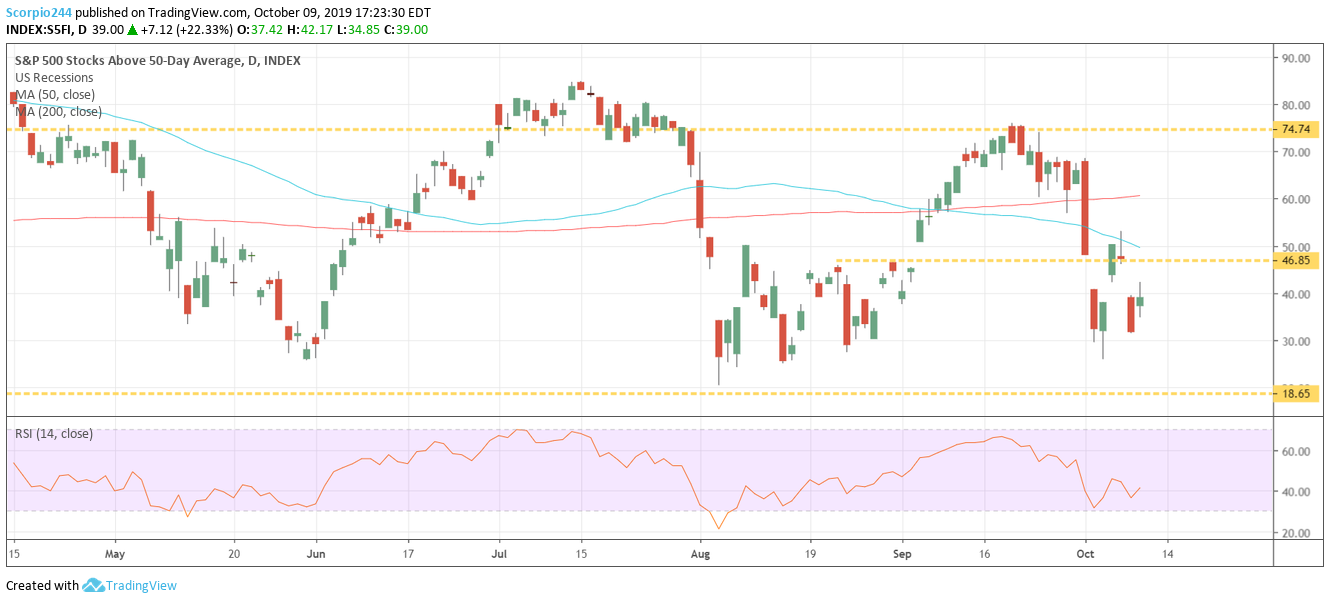
The number of stock above their 50-day moving average is still below 40% and hardly moved today, remaining at the lower end of the range.
Anyway, I don’t think anything major changed today in terms. It was a step in the right direction, but it does point to tomorrow potentially being a make or break moment in terms of the course the market goes next.
The downtrend, the gap, and resistance all converge tomorrow.
The Fed
I am beginning to think that the Fed may have as many as three rate cuts ahead of it. I talked about why I thought that was the case in a video today. Here’s Why The Fed May Cut Rates 3 More TimesSTOCKS
Roku (NASDAQ:ROKU)
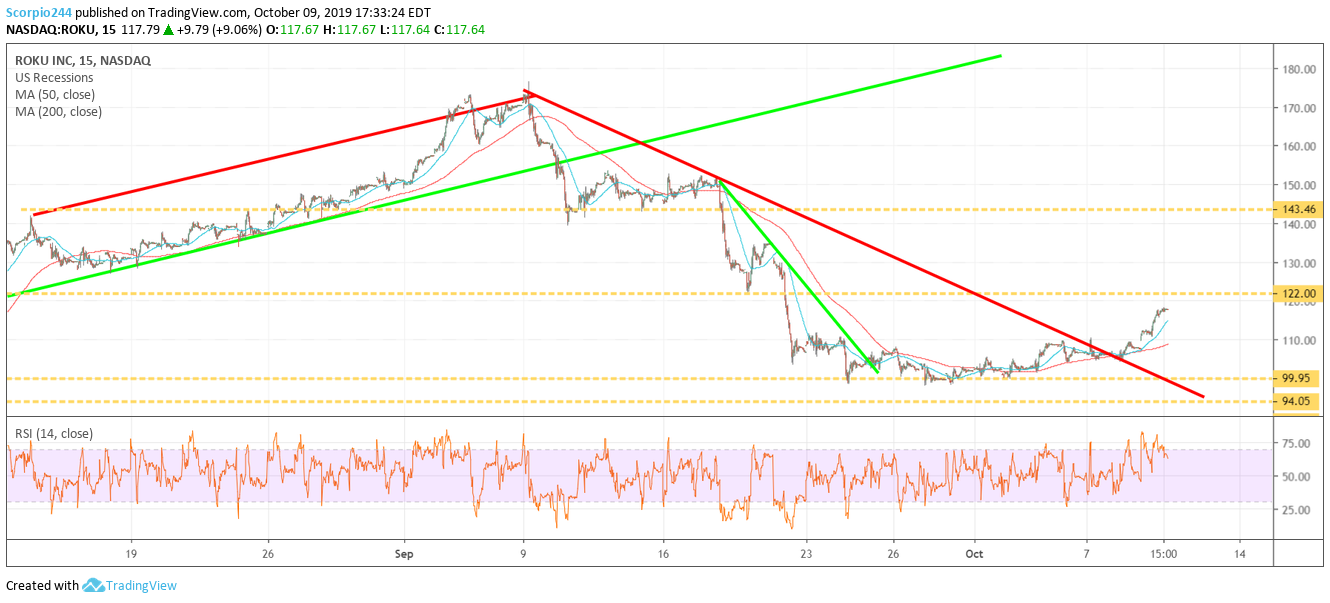
Roku had a strong day after breaking the downtrend. It surged by 9% to finish around $118. It didn’t get to $122, but it is likely heading there. I did note yesterday on my mid-day update that I though Roku could be heading higher to $122. Which was a change in my view from the morning write-up. Stocks Fill The Lower Gap
Cisco (NASDAQ:CSCO)
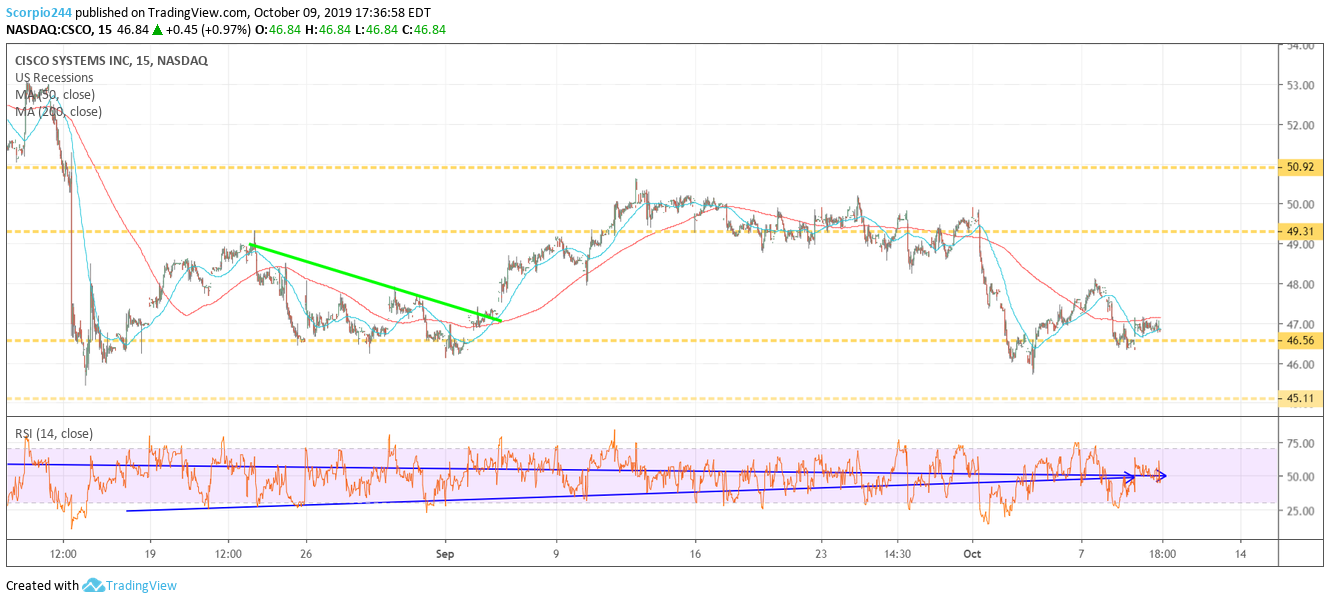
Cisco (NASDAQ:CSCO) was up some today, and I wrote a premium article talking about why I thought the stock could rise to around $49.30 in the weeks ahead. Betting Cisco Rises – I give you the first two weeks to try it for FREE, if you hate it you can cancel.
Tesla (NASDAQ:TSLA)
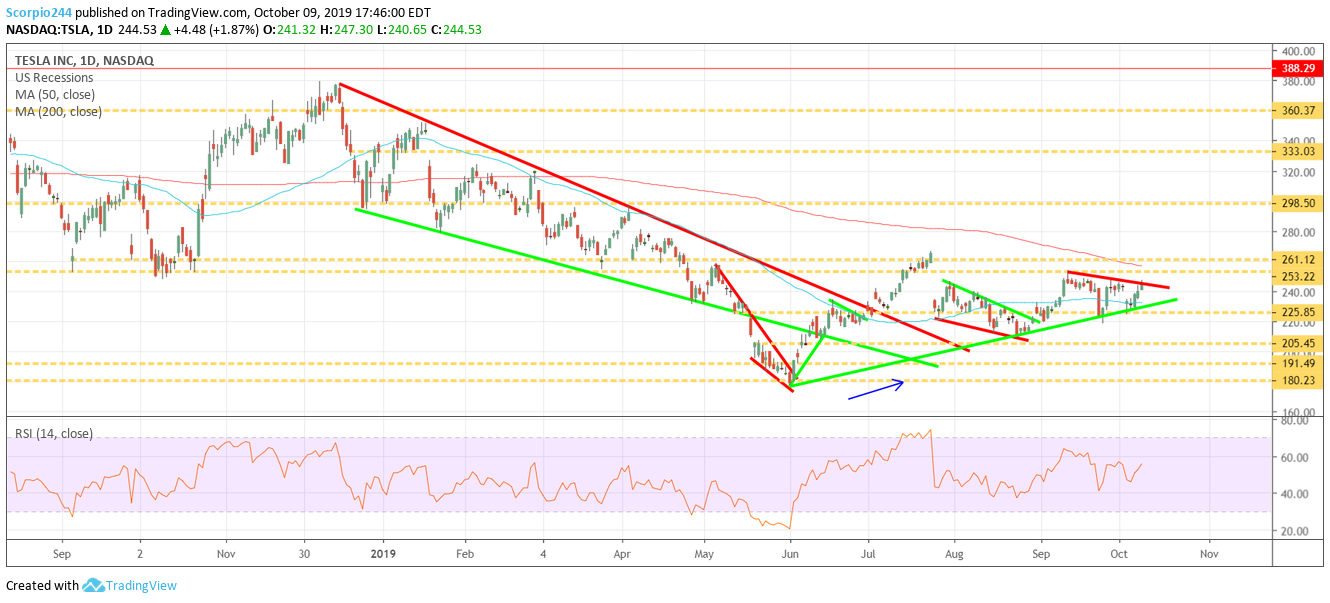
Tesla appears to be forming a symmetrical triangle, which is usually a continuation pattern. In this case, it would indicate the stock is likely to rise, perhaps back to $261.Shopify (SHOP)
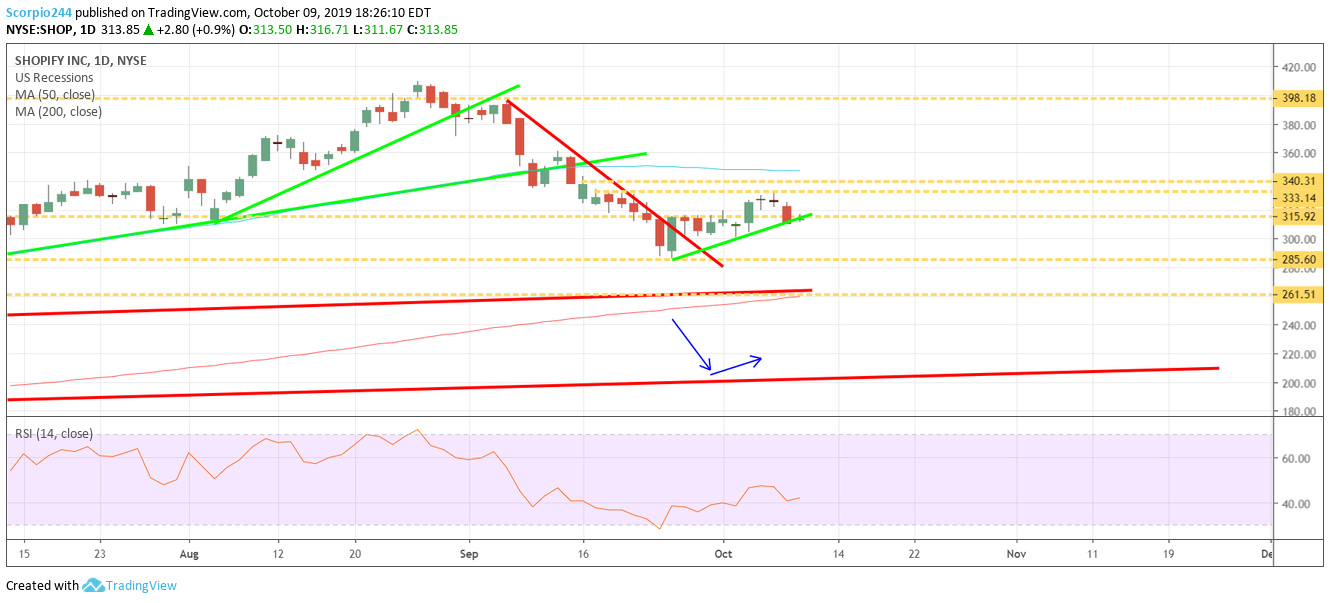
I’m not sure what is happening here with SHOP, but it isn’t looking good. The stock is now trading sideways through the mini-uptrend that formed. It is also once again failing at the $315 region. Not good. It may need to fall back to $285 again before it goes anywhere else.
