Bulls Breakout To New Highs
A couple of weeks ago, I wrote a wildly unpopular article laying out why, if the bulls could push the markets to new all-time highs, the next target would be 3750. With the market now at new all-time highs, and the bulls clearly in charge, is it “safe” for investors to become complacent? Maybe, not.
Technical analysis works well when there are defined “knowns” such as a previous top (resistance) or bottom (support) from which to build analysis. However, when markets break out to new highs, it pretty much becomes a “wild @$$ guess” or “WAG.”
However, we did previously attempt to establish some reasonable targets based on relative “risk/reward ranges,”
“With the markets closing just at all-time highs, we can only guess where the next market peak will be. Therefore, to gauge risk and reward ranges, we have set targets at 3500, 3750, and 4000 or 4.4%, 12.2%, and 19.5%, respectively.”
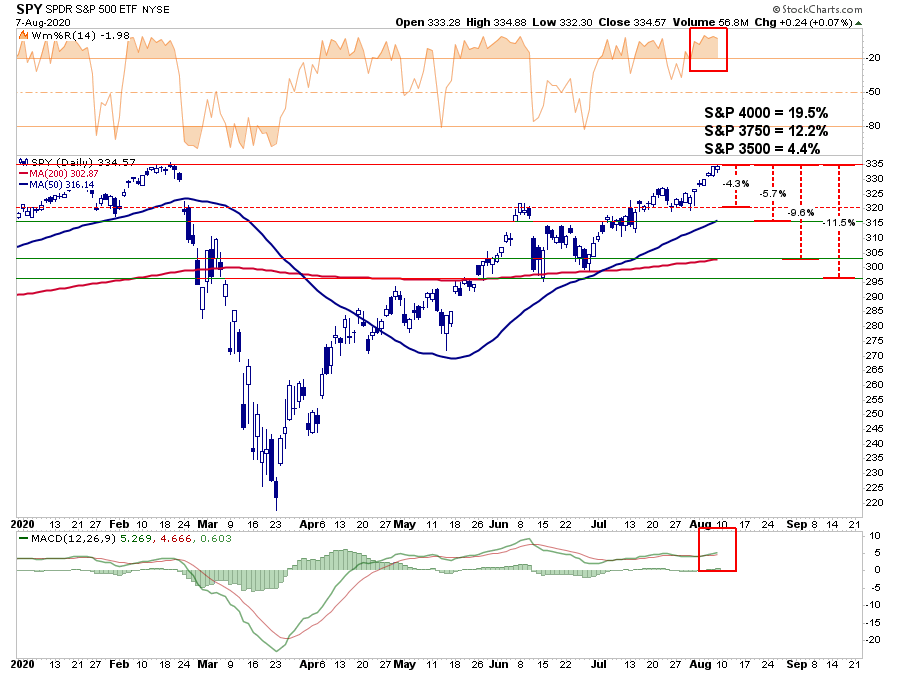
“Given there is no good measure to justify upside potential from a breakout to new highs, you can personally go through a lot of mental exercises. While there is certainly a potential the market could rally 19.9% to 4000, it is also just as reasonable the market could decline 22.2% test the March closing lows.
Just in case you think that can’t happen, just remember no one was expecting a 35% decline in March, either.”
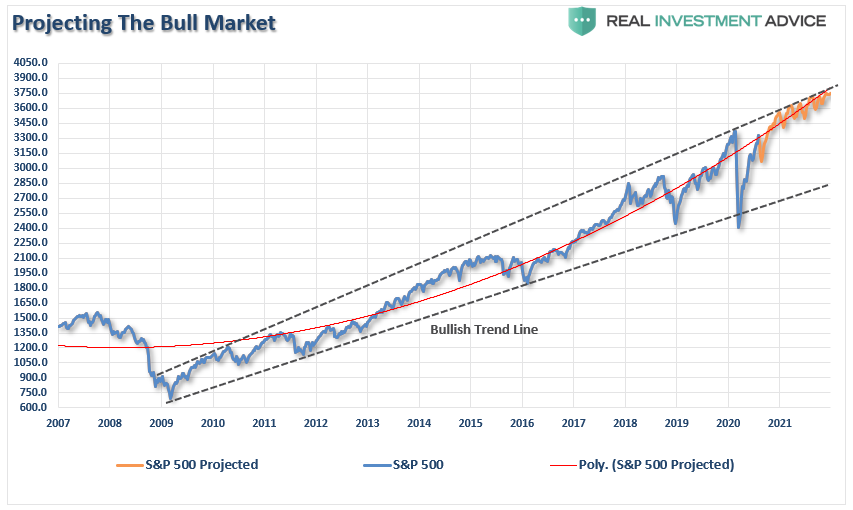
We then delved into establishing a target using the well-established trendlines from the 2009 lows. Given these trendlines have held for over a decade, we can only reasonably assume they will hold in the future. Therefore, since the upper bullish trend line coincides with the February 2020 market peak and the polynomial trend line, 3750 is the next reasonable target.
Markets At Technical Extremes
The markets currently are at historic market extremes. I explained this concept in much more detail in Friday's #Macroview.
However, the most critical point of that article was the extreme deviation from long-term means. As noted, trend lines and moving averages tend to act as “gravity.” The further away the market moves from the trendline, the greater the pull becomes.
“Kyōki is the Japanese word for “insanity.” That was the word that came to mind when my co-portfolio manager, Michael Lebowitz, emailed me the following chart.”
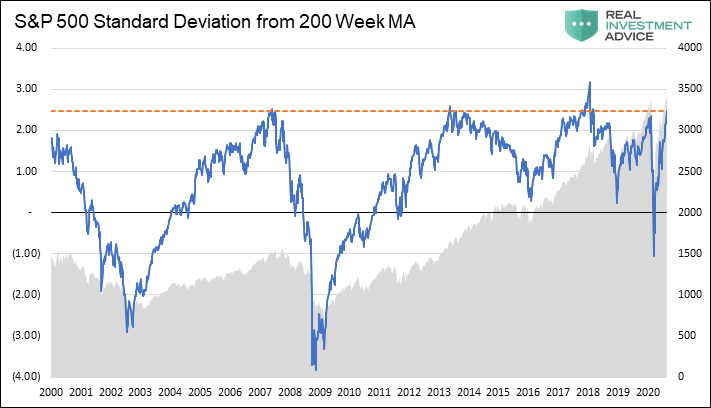
“The chart is WEEKLY data, which smooths out some of the short-term volatility. What is displayed is the standard deviation of the market from its 200-WEEK (4-year) moving average.
Notably, each time of the 5-times previously, going back to 1999, where the market traded at 2-standard deviations or higher from the 4-year moving average, a reversion occurred. Those periods were 2000, 2007, 2014, 2018, February 2020, and now.”
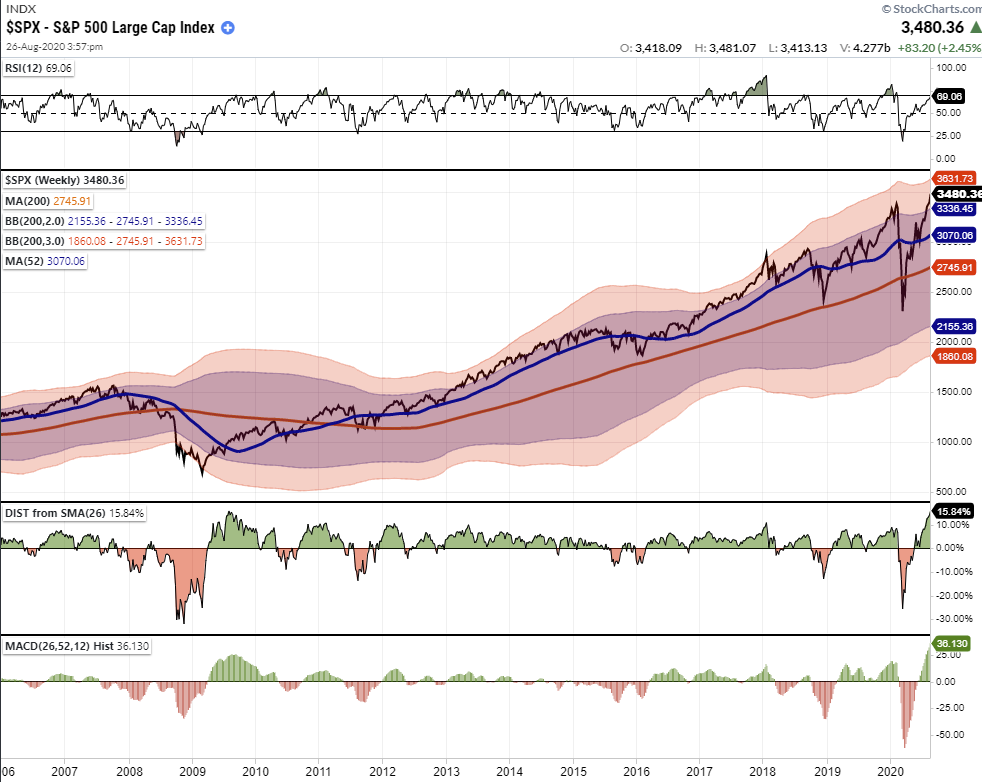
It is remarkable given the economic devastation; the S&P 500 is trading at not only at record highs, but at near-record deviations of the 4-year moving average and MACD readings. Historically, such deviations resolve through a correction or a full-fledged bear market.
Such is just statistical evidence of more extreme positioning by investors in the short-term. As I discussed in “Revisiting Bob Farrell’s 10 Investing Rules”:
“Like a rubber band that has been stretched too far – it must be relaxed in order to be stretched again. This is exactly the same for stock prices that are anchored to their moving averages. Trends that get overextended in one direction, or another, always return to their long-term average. Even during a strong uptrend or strong downtrend, prices often move back (revert) to a long-term moving average.”
More Signs Of Exuberance
While prices are clearly at historic extremes on many levels, we continue to see more numerous indicators showing extreme signs of “exuberance” in the markets.
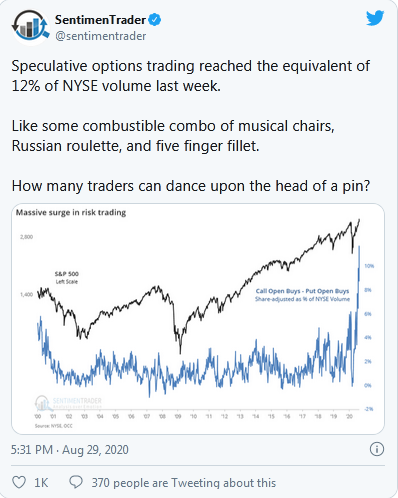
This tweet from Sentiment Trader summed it up best.
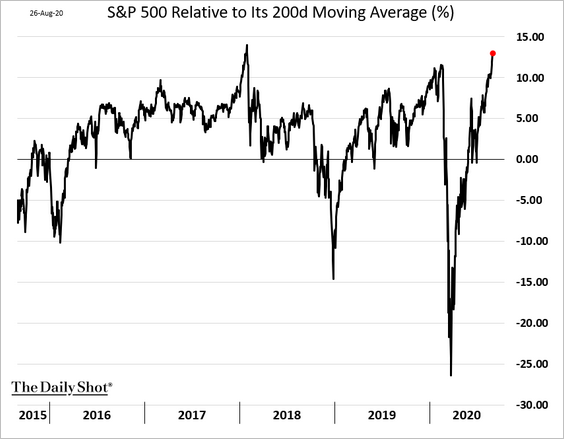
As noted in the weekly charts above, the S&P is also trading at extreme levels above its shorter-term daily moving averages as well.
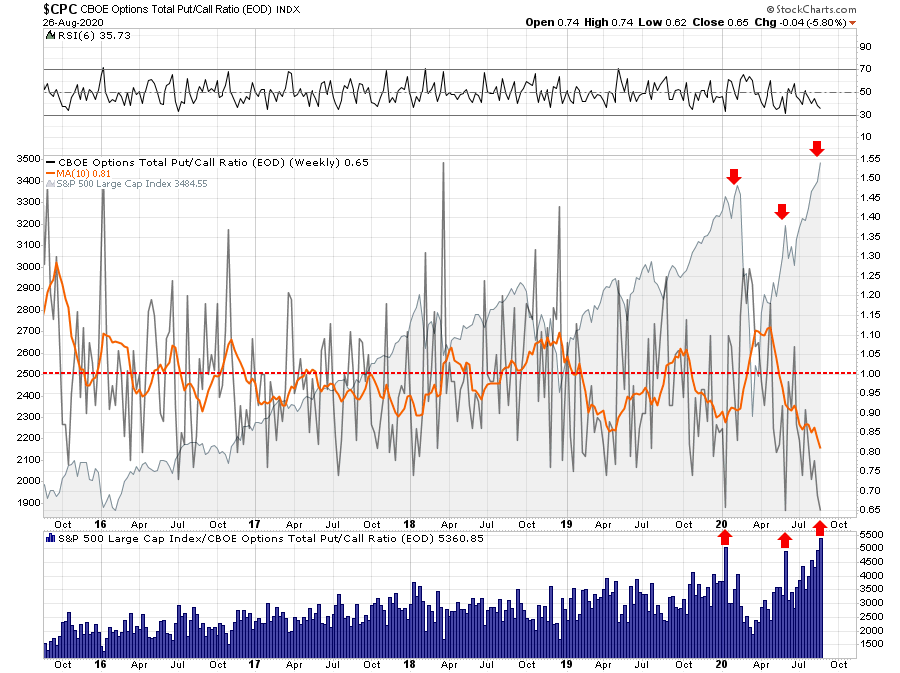
With “shorts” now at historically levels, market participants have given up hedging portfolios against a correction. Historically low put/call ratios have always coincided with short-term corrections or worse. It is one of the lowest levels since the peak of the market in 1999.
The stock/bond ratio has also reached levels more normally consistent with short-term market peaks and corrective actions.
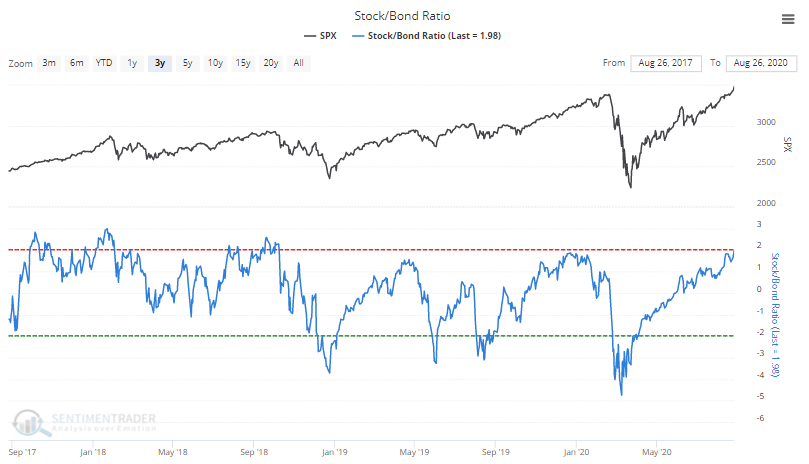
The rise in the stock/bond ratio is not surprising, given the level of exuberance by retail investors.
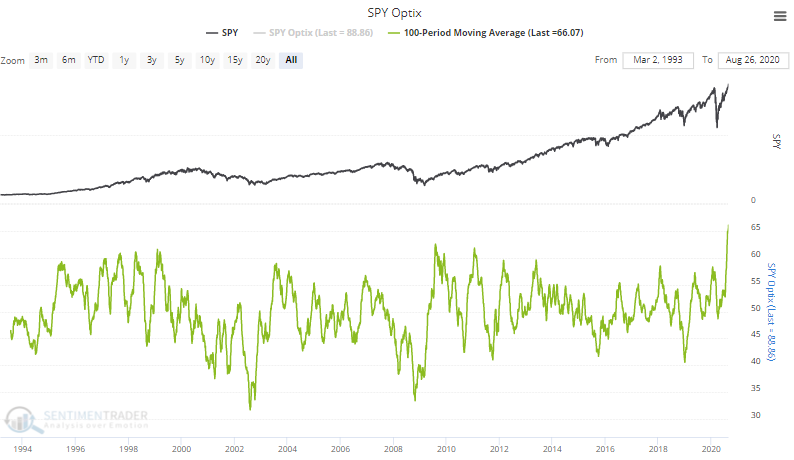
None of this data means the market is about to crash.
What it does mean, as we discussed last week in “Winter Approaches,” is that a correction of 5-10% has become increasingly likely over the next few weeks to two months. While a 5-10% correction may not seem like much, it will feel much worse due to the high level of complacency by investors currently.
All of the data suggests that “Winter Is Coming.” Therefore, this is why we are adding “value” to our portfolios to prepare for colder weather.
Is There A Rotation To Value Coming
Why value?
As Michael Lebowitz, CFA previously noted:
“As a result of these behaviors, we have witnessed a divergence in what has historically spelled success for investors. Stronger companies with predictable income generation and solid balance sheets have grossly underperformed companies with unreliable earnings and over-burdened balance sheets. The prospect of majestic future growth has trumped dependable growth. Companies with little to no income and massive debts have been the winners.”
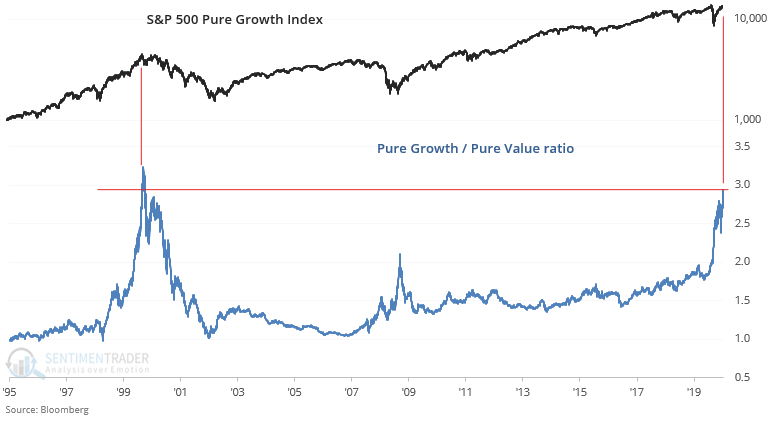
This underperformance of “value” relative to “growth” is not unique. What is unusual is the current duration and magnitude of that underperformance. Such underperformance was only seen previously in 1999-2000.
10-Year Total-Return Failure
The graph below charts ten-year annualized total returns (dividends included) for value stocks versus growth stocks. The most recent data point representing 2019, covering the years 2009 through 2019, stands at negative 2.86%. Such indicates value stocks have underperformed growth stocks by 2.86% on average in each of the last ten years.
The data for this analysis comes from Kenneth French and Dartmouth University.
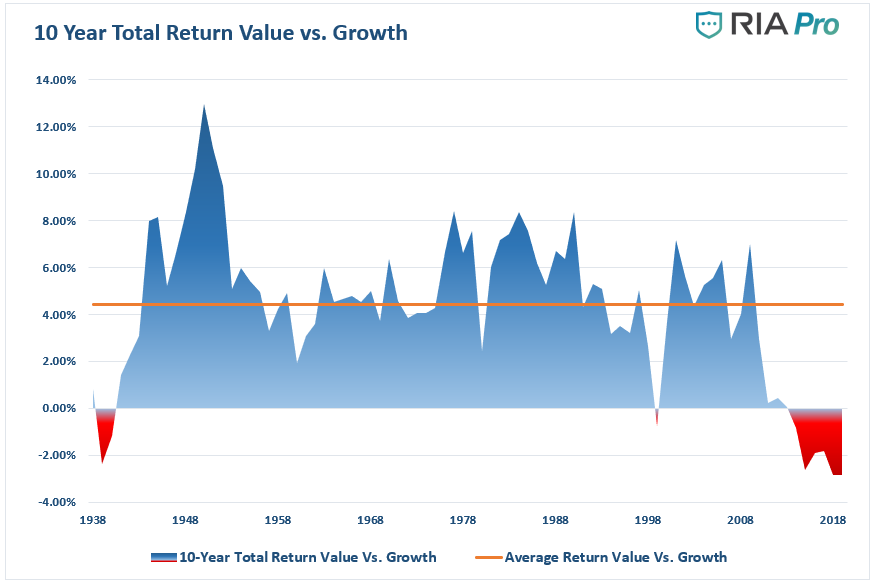
There are two critical takeaways from the graph above:
- Over the last 90 years, value stocks have outperformed growth stocks by an average of 4.44% per year (orange line).
- There have only been eight ten-year periods over the last 90 years (total of 90 ten-year periods) when value stocks underperformed growth stocks. Two of these occurred during the Great Depression, and the other spanned the 1990s leading into the Tech bust of 2001. The other five are recent, representing the years 2014 through 2019.
Mirror Opposites
The chart shows the difference in the performance of the “value vs. growth” index. The value and growth indices are each based on a $100 investment. While value investing always provides consistent returns, there are times when growth outperforms value. The periods when “value investing” has the most significant outperformance, as noted by the “blue shaded” areas, are notable.
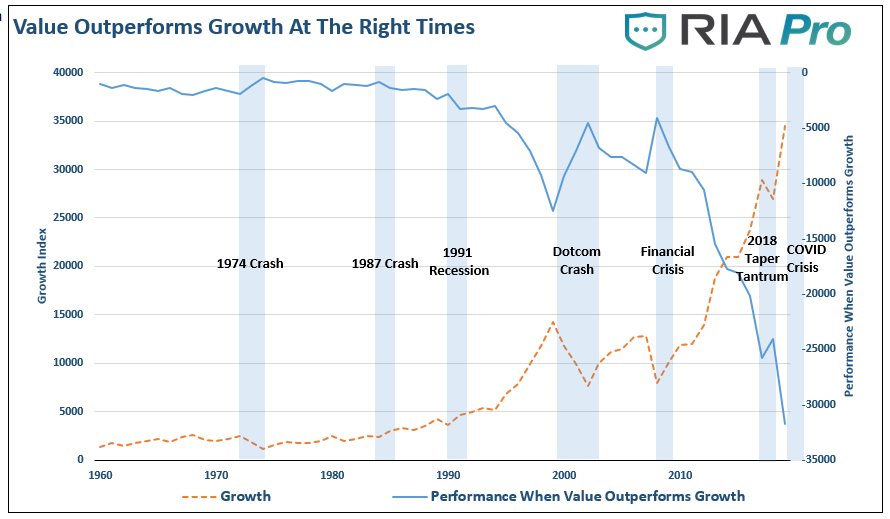
The question is, what are the causes of this underperformance, and eventually, outperformance.
Reasons For Under-performance
As Research Affiliates noted:
“The Fama–French value factor, and value investing in general, has suffered an extraordinarily long 13.3 years of underperformance relative to the growth investing style. The current drawdown has been by far the longest as well as the largest since July 1963.
An investment strategy, style, or factor can suffer a period of underperformance for many reasons.
- First, the style may have been a product of data mining, only working during its backtest because of overfitting.
- Second, structural changes in the market could render the factor newly irrelevant.
- Third, the trade can get crowded, leading to distorted prices and low or negative expected returns.
- Fourth, recent performance may disappoint because the style or factor is becoming cheaper as it plumbs new lows in relative valuation.
- Finally, flagging performance might be a result of a left-tail outlier or pure bad luck.
If the first three reasons imply the style no longer works, and will not likely benefit investors in the future, the last two reasons have no such implications.
With today’s value vs. growth valuation gap at an extreme (the 100th percentile of historical relative valuations), it sets the stage for a potentially historic outperformance of value relative to growth over the coming decade.”
The reasons for underperformance are also the reasons for potential outperformance in the future. When something in the market ultimately goes “pear-shaped,” the return to value tends to be a swift event.
Such is the reason we are starting to add value to our portfolio. When “winter comes,” we have little doubt the value-growth relationship will revert to its long-term mean.
Be Careful Declaring Value Dead
While the current market advance seems to be unstoppable, such was always what investors believed at every prior market peak in history. As Howard Marks once stated:
“Rule No. 1: Most things will prove to be cyclical.
Rule No. 2: Some of the most exceptional opportunities for gain and loss come when other people forget Rule No. 1.”
The realization that nothing lasts forever is crucial to long term investing. To “buy low,” one must have first “sold high.” Understanding that all things are cyclical suggests that after significant price increases, investments become more prone to declines than further advances.
The rotation from “growth” to “value” is inevitable. It will occur against a backdrop of devastation for the majority of investors quietly lulled into the extreme sense of complacency years of monetary interventions have provided.
As Research Affiliates concludes:
“Overall, relative valuations are in the far tail of the historical distribution. If, as history suggests, there is any tendency for mean reversion, the expected future returns for value are elevated by almost any definition.”
The only question is whether you will be the buyer of “value” when everyone else is selling “growth?”
Portfolio Positioning
As we discussed last week in “Tending The Garden,” there is a good analogy between gardening and portfolio management. I put together a short video last week as a recap.
Such is where we are currently.
While we remain long-biased in our equity portfolios, we have begun to “harvest” some of our big winners (take profits), and do some “winter preparation” by adding to our defensive “value” oriented positions, and our risk hedges.
In the short-term, this will indeed provide some drag between our portfolio and the major market index. However, when the first “cold snap” washes across the markets, our preparation should protect our garden from “frostbite.”
We indeed remain “bullish” on the markets currently as momentum is still in play. However, just as any farmer is keenly aware of the signs “Winter” is approaching, we are just taking some precautionary actions. As noted last week:
“If you wait for the “blizzard” to hit, it will be too late to make much difference.”
