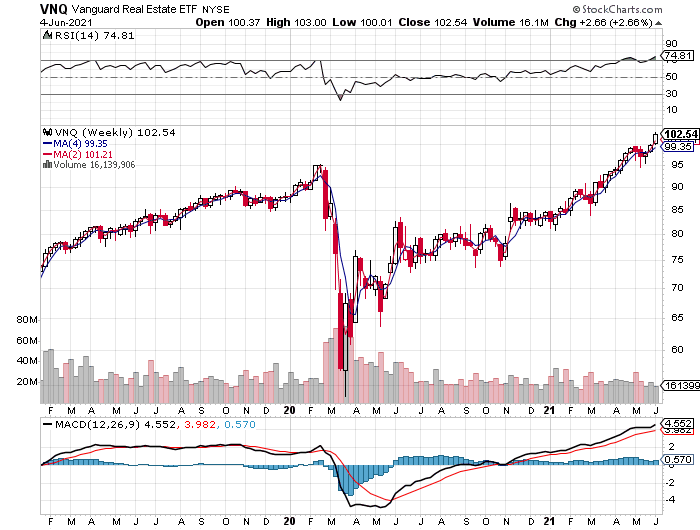
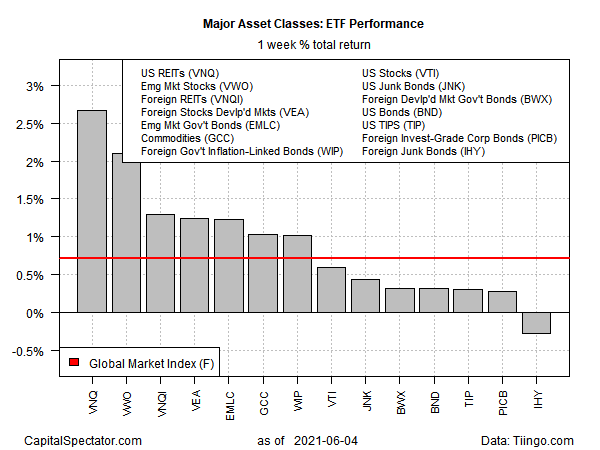
Nearly every slice of the major asset classes posted a gain last week, based on a set of exchange traded funds, led by real estate investment trusts (REITs) in the US.
Vanguard Real Estate Index Fund ETF Shares (NYSE:VNQ) jumped 2.7% for the trading week through June 4. The gain marks the third weekly advance for the fund, which closed just slightly below a record high.

Most market buckets rose last week too, with one exception: foreign junk bonds. VanEck Vectors International High Yield Bond ETF (NYSE:IHY) slipped 0.3%, although the ETF remains close to a record close.
Widespread market gains lifted an ETF-based version of the Global Market Index (GMI.F), which increased 0.7% last week. This unmanaged benchmark holds all the major asset classes (except cash) in market-value weights via ETF proxies.

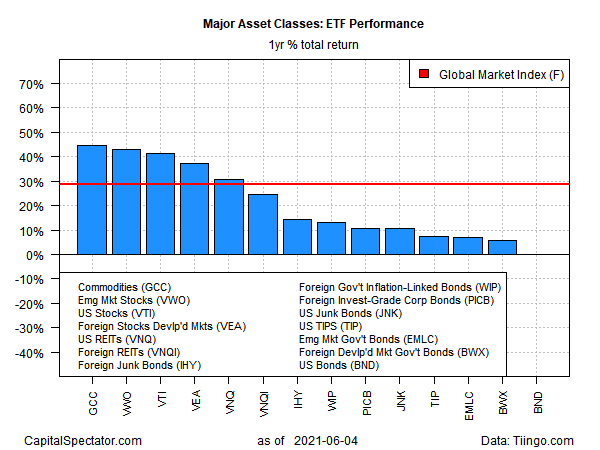
For the trailing one-year window, a broadly defined, equal-weighted measure of commodities led the field. WisdomTree Continuous Commodity Index Fund (NYSE:GCC) is up 44.8% vs. the year-ago level. In close pursuit: emerging markets stocks via Vanguard FTSE Emerging Markets Index Fund ETF Shares (NYSE:VWO), which is the second-best one-year performer.
The weakest performer for the past 12 months: US investment-grade bonds via Vanguard Total Bond Market Index Fund ETF Shares (NASDAQ:BND), which is essentially flat for the past year on a total return basis.
GMI.F is up 28.7% for the trailing one-year window.

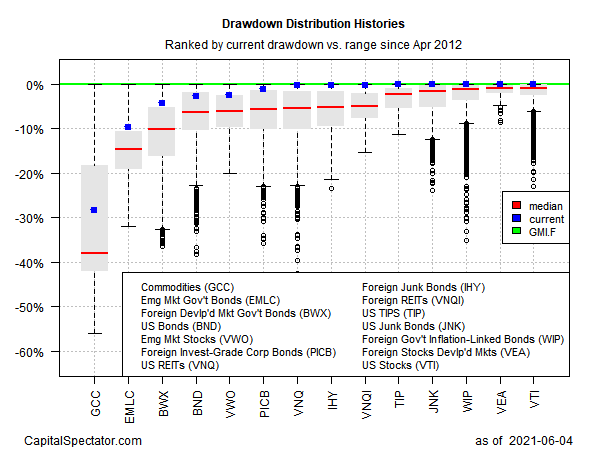
Monitoring funds through a drawdown lens shows that several ETFs posted zero peak-to-trough declines at the moment, including US stocks—Vanguard Total Stock Market Index Fund ETF Shares (NYSE:VTI).
The deepest drawdown is still found in broadly defined commodities via WisdomTree Continuous Commodity Index Fund (GCC). The ETF is down 28.4% from its previous high.
GMI.F’s current drawdown is currently zero after the index closed at a record high on Friday.

