Will The Dow Trade Sideways For Another 21 Months?

Published 12/19/2017, 12:04 PM
Updated 07/09/2023, 06:31 AM

As the Dow is quickly approaching the 25,000 level, some might find it hard to remember that in the very near past, it traded sideways for 21 months.

The question is, why didn't the index make any progress for more than a year and half? Part of the reason could be a key Fibonacci extension level.

Below looks at the Dow Jones Industrial index over the past 13 years, where the Power of the Pattern applied Fibonacci Extension levels to the weekly closing highs in 2007 and weekly closing lows in 2009.
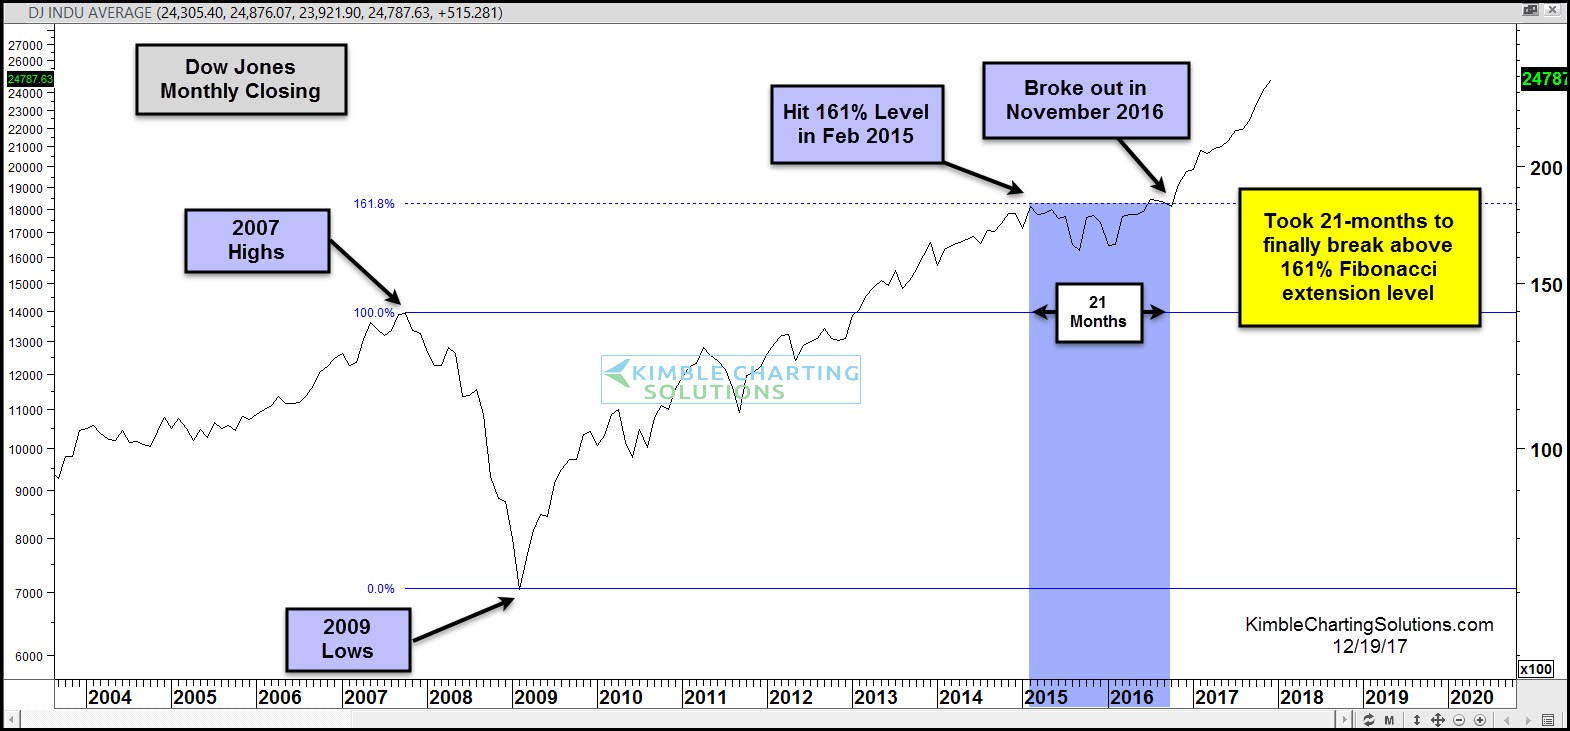
Monthly Dow Closings

If you had applied a Fibonacci extension level to the Dow at the 2009 lows, it would have suggested that if the Dow broke above the 2007 highs, it might find the 18,000 zone as a form of resistance in the future. In February of 2015, the Dow hit this level for the first time, then proceeded to chop sideways for the next 21 months. It took nearly a year and a half to finally break above the 161% level, which took place near last year's election (November 2016).

Below looks at an update of the Dow with the next Fibonacci extension level (261%) applied.
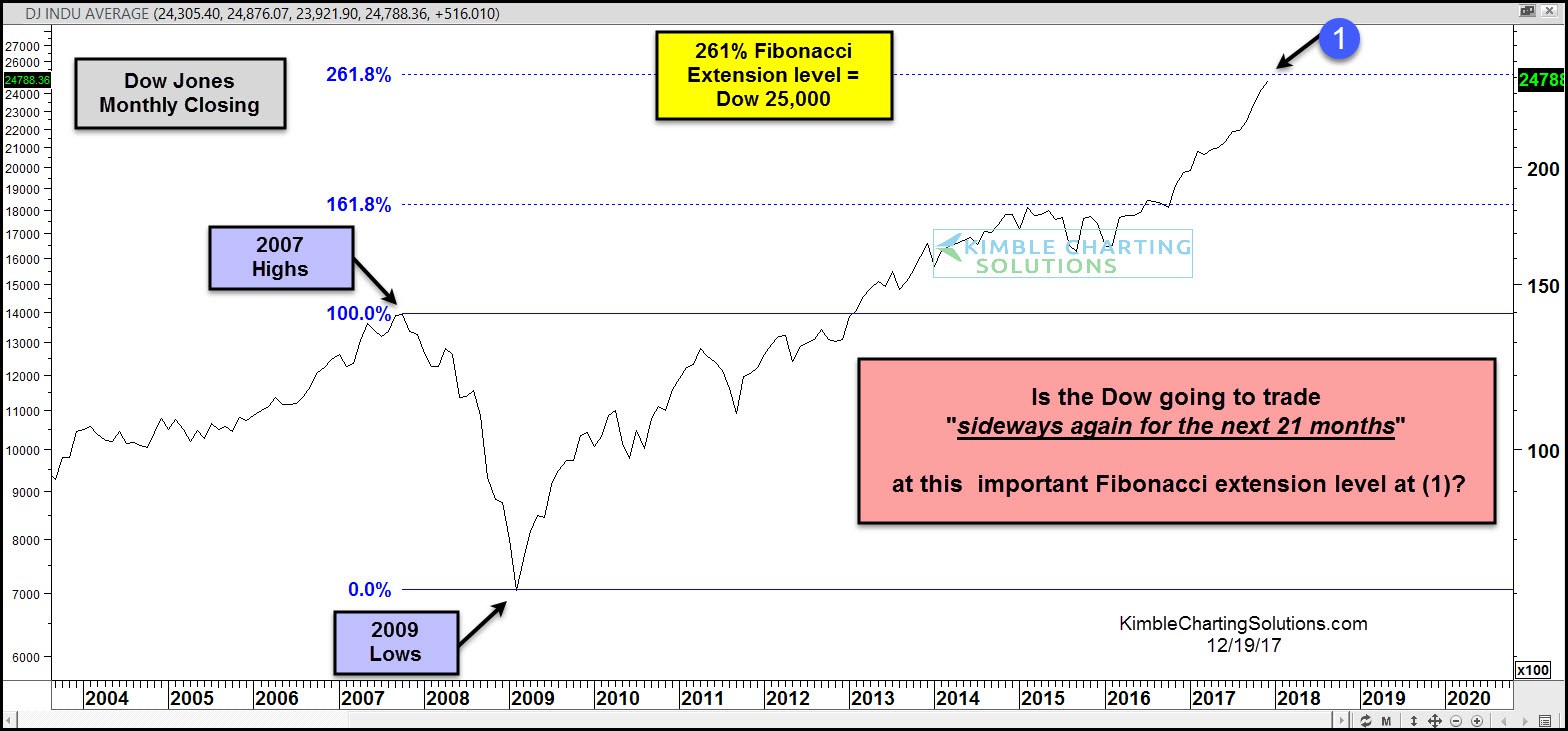
The Dow's Next Fibonacci Extension

The sharp rally since last November now has the Dow quickly approaching the Fibonacci 261% Extension level, which comes into play at the 25,000 zone at (1) above.

Will this key extension level based on the 2007 highs and 2009 lows cause the Dow to trade sideways for another 21 months? I doubt that many thought the 161% level would become a resistance zone for the Dow at the time and it is understandable to question if the Dow will find the 261% level as resistance as well.

No doubt, the trend is up and the Advance/Decline line shows NO signs of slowing at this time. Remember that this move took place at the 161% level and we could be within a couple of percent of another key extension level right now.

We will see over the next few months if this time is different.

Latest comments

Loading next article…
Risk Disclosure: Trading in financial instruments and/or cryptocurrencies involves high risks including the risk of losing some, or all, of your investment amount, and may not be suitable for all investors. Prices of cryptocurrencies are extremely volatile and may be affected by external factors such as financial, regulatory or political events. Trading on margin increases the financial risks.
Before deciding to trade in financial instrument or cryptocurrencies you should be fully informed of the risks and costs associated with trading the financial markets, carefully consider your investment objectives, level of experience, and risk appetite, and seek professional advice where needed.
Fusion Media would like to remind you that the data contained in this website is not necessarily real-time nor accurate. The data and prices on the website are not necessarily provided by any market or exchange, but may be provided by market makers, and so prices may not be accurate and may differ from the actual price at any given market, meaning prices are indicative and not appropriate for trading purposes. Fusion Media and any provider of the data contained in this website will not accept liability for any loss or damage as a result of your trading, or your reliance on the information contained within this website.
It is prohibited to use, store, reproduce, display, modify, transmit or distribute the data contained in this website without the explicit prior written permission of Fusion Media and/or the data provider. All intellectual property rights are reserved by the providers and/or the exchange providing the data contained in this website.
Fusion Media may be compensated by the advertisers that appear on the website, based on your interaction with the advertisements or advertisers.
© 2007-2025 - Fusion Media Limited. All Rights Reserved.