- The market expected a 133 bcf withdrawal as of February 14
- Only five short weeks to go until spring in the natural gas futures market
- A recovery takes the price above $2, but selling could lurk above with March on the horizon
After trading down to a low of $1.753 per MMBtu on the nearby March NYMEX futures contract on February 11, the price of the energy commodity made a comeback over the past week. Last Monday, the Natural gas price gapped higher, leaving a void on the daily chart. The high on Friday, February 14, was at $1.795 and the low last week was $1.874. Almost continuous selling since the early November 2019 peak created an oversold condition, and the natural gas future market became overly short. The price rose above the psychological $2 per MMBtu on Thursday, February 20.
It could be late for a significant recovery in the 2019/2020 peak season for the natural gas market. We are about five weeks away from the time of year when stockpiles in storage begin to rise during the current injection season. The United States Natural Gas Fund (NYSE:UNG) replicates the price action in the nearby natural gas futures contract on NYMEX.
The Market Expected 133 bcf Withdrawal As Of February 14
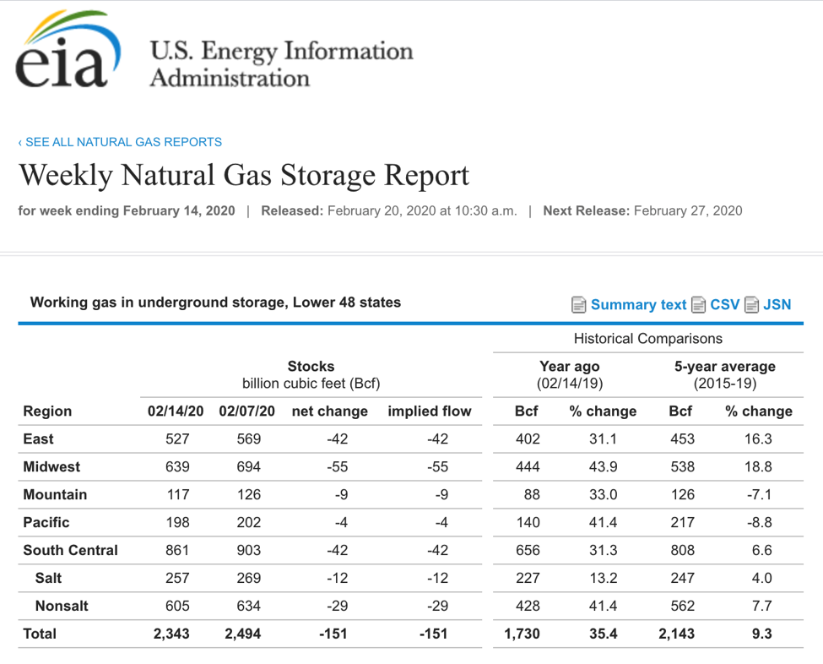
On Thursday, February 20, the Energy Information Administration reported that stockpiles of natural gas in storage across the United States declined by 151 billion cubic feet for the week ending February 14.

(Source: EIA)
As the chart illustrates, natural gas inventories stood at 2.343 trillion cubic feet as of February 14 – 35.4% above last year’s level and 9.3% higher than the five-year average for this time of year.
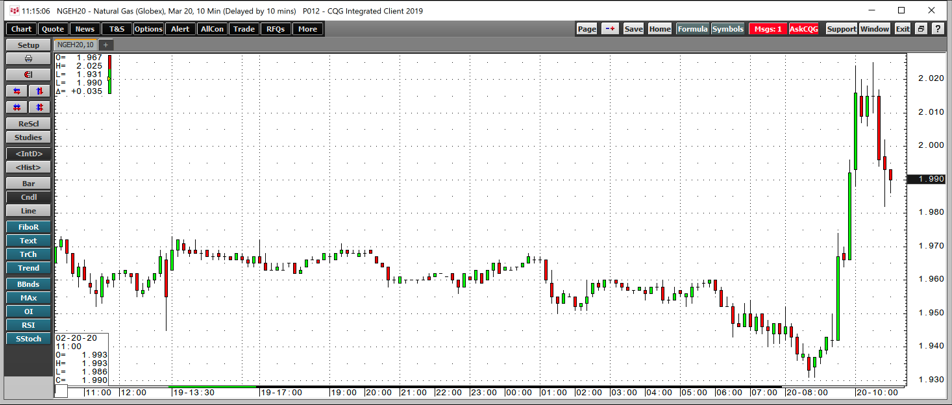
Nat gas had rallied earlier in the week and remained above the $1.90 level but below $2.00 per MMBtu. The latest EIA report caused the price to probe above the psychological price for the energy commodity.

(Source: CQG)
The ten-minute chart shows that the price spiked higher in the aftermath of the latest EIA inventory report, reaching a peak of $2.025 per MMBtu.
Only Five Short Weeks Until Spring Hits The Natural Gas Futures Market
Natural gas rallied from $1.7530 to $2.025 per MMBtu or 15.52% since February 11. While we are still in peak season for demand, there are only about five weeks before weekly inventory declines shift to increases. Last year, stockpiles in storage reached a low of 1.107 tcf. With a total of 2.343 tcf in stocks as of February 14, the average withdrawal over the coming five weeks would need to be 247.2 bcf to reach last year’s low. As the highest withdrawal so far during this peak season was at 201 bcf, stocks will begin to rise from a significantly higher level in 2020 compared to 2019.
Recovery Takes Price Above $2, Selling Could Lurk Above With March On The Horizon
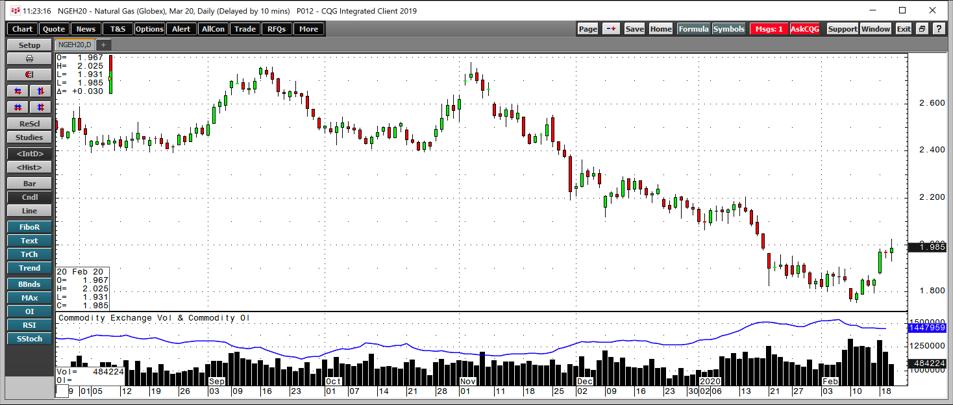
Overwhelmingly bearish sentiment drove the price of natural gas from $2.905 per MMBtu in early November to a low of $1.753 on February 11.

(Source: CQG)
As the daily chart of March NYMEX futures highlights, the total number of open long and short positions declined from a high of 1.54 million contracts on February 6 when the energy commodity was on its way to the low at $1.735 per MMBtu. The metric had declined by over 90,000 contracts to the 1.448 million contract level as of February 19. The decline in open interest was likely the result of short-covering and profit-taking. As the price is now around $2 per MMBtu with the end of the peak season for demand a little more than one month away, the odds of another push to the downside remain high.
The United States Natural Gas Fund L.P. (UNG) was trading at $15.31 per share on Thursday afternoon, up $0.03 (+0.20%). Year-to-date, UNG has declined -34.35%, versus a 26.10% rise in the benchmark S&P 500 index during the same period.
UNG currently has an ETF Daily News SMART Grade of C (Neutral), and is ranked #51 of 109 ETFs in the Commodity ETFs category.
