It’s all about jobs now. Actually, it’s always been about jobs. But the stakes are even higher—perhaps more so than at any time since the Great Recession ended–in the wake of yesterday’s weak GDP report for the first quarter.
The bullish case for the US stock market is now closely linked with ongoing growth in payrolls—next week’s April report in particular. Judging by yesterday’s weekly update on initial jobless claims, optimists can argue that the labor market’s near-term outlook remains bright. Although new filings for unemployment benefits increased for the week through Apr. 23, the four-week average for claims fell to its lowest level since 1973. In addition, the year-over-year change for claims—before and after seasonal adjustment—continues to decline. In sum, this leading indicator is pointing to another solid report for the May 6 update on payrolls in April.
The stock market could use some encouraging macro news after the disappointing Q1 GDP report. In fact, rosy expectations for next week’s labor market data may be all that’s standing in the way of new leg down for equities.
Meantime, the technical profile for the S&P 500 at the moment looks wobbly. Perhaps the April numbers on payrolls will render this weakness null and void. Note, however, that the S&P 500’s rally over the last two months hit a wall—or a ceiling, to be more precise. After mounting an impressive rally since late-Feb, the S&P stalled this week. Note that the latest high-water marks fell short of last year’s peak, which marks an all-time high for the index. Maybe that’s just noise, but it’s conspicuous that the S&P’s rolling one-year return has been mildly negative over the past several trading days—a change for the worse that casts doubt on the recent rise of the 50-day average above the 200-day average, aka, the bullish golden cross formation.
Another case of MIA: a positive one-year return that’s accompanied by a 50-day average that’s above the 200-day average. The last time we saw that bullish mix: last August, before the trouble started.
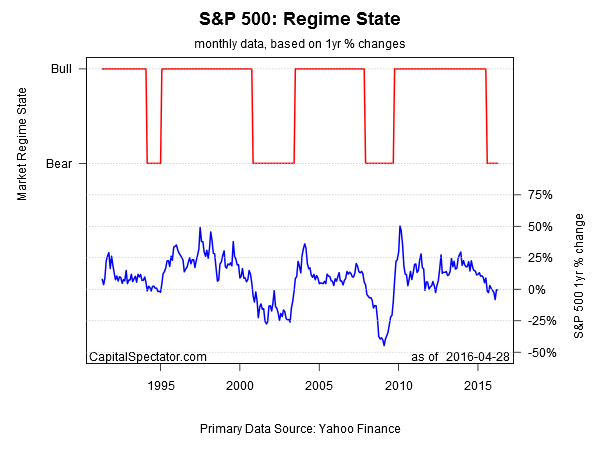
Technical-analysis hogwash? Maybe. But running the S&P numbers through an econometric lens—a Hidden Markov model—that’s been a semi-regular feature on these pages continues to signal that US equities are in a bear market. The shift to the dark side on this front, which occurred last autumn, was on verge of looking irrelevant during the recent rally. But the fact that the market’s latest rise has stumbled–and economic growth looks shaky–revives the possibility that the last two months have been a sucker’s rally.
All of which leads us back to next week’s payrolls report for April. A strong number will boost confidence that the Q1 GDP data is just a temporary soft patch that will soon give way to firmer growth in Q2 and beyond. Otherwise, there’ll be hell to pay if the April payrolls data dispenses a bearish surprise.
And so here we are, sitting on a pin, waiting for a single economic report to confirm or deny the endurance of an economic recovery and equity bull market that date to mid-2009.
One clue for thinking positively: ADP last week published a report that found that “the labor market maintained its improvement in the first quarter of 2016 with discernible acceleration in wage growth.” Is that a sign that good news awaits in next Friday’s jobs report? And the answer is….


