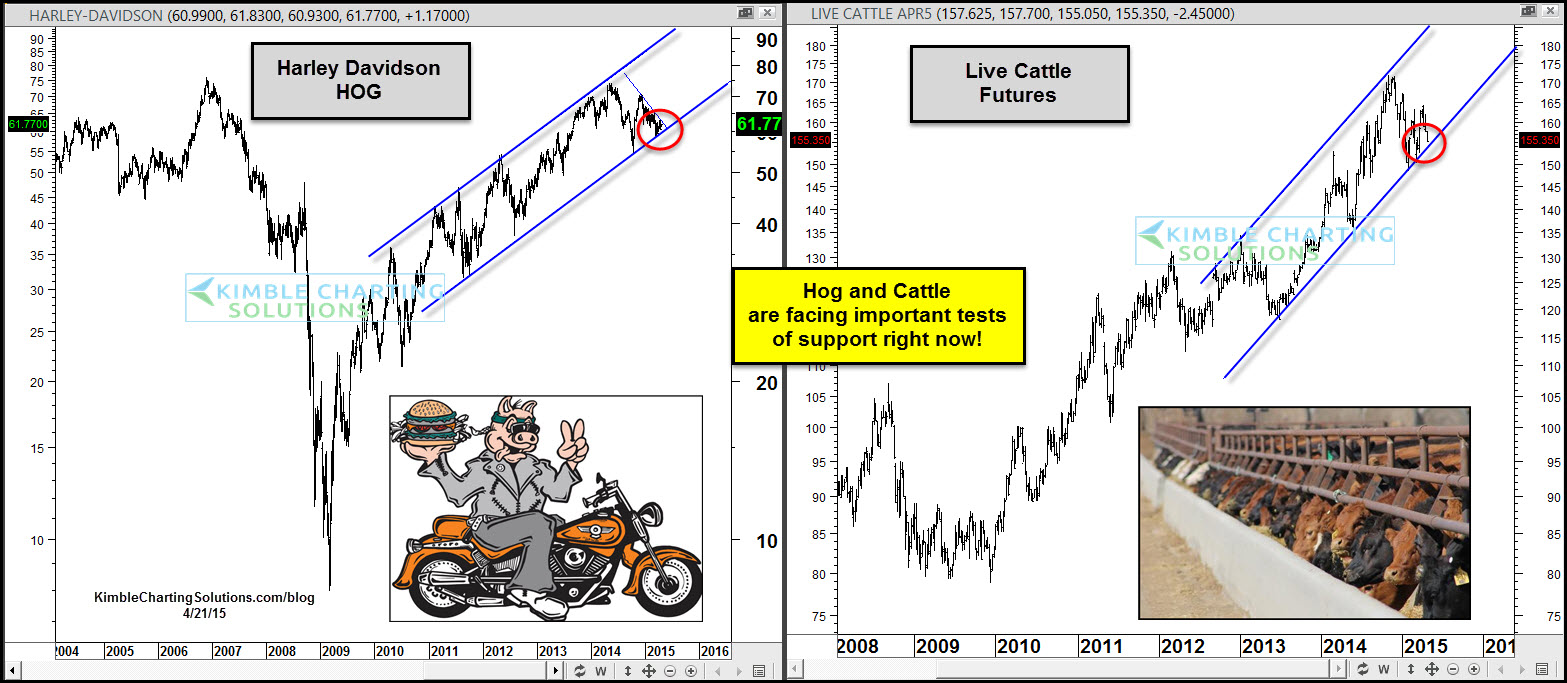
Harley-Davidson (NYSE:HOG) has remained inside of a steep rising channel the past 4 years. At this point, it's testing rising support of this channel.
At the same time, the Live Cattle futures pattern looks very much like Hog’s pattern, as steep rising support is being tested at this time.
In the 2008-2009 time period, HOG and Cattle both fell over 30% in price as the S&P 500 was falling hard as well.
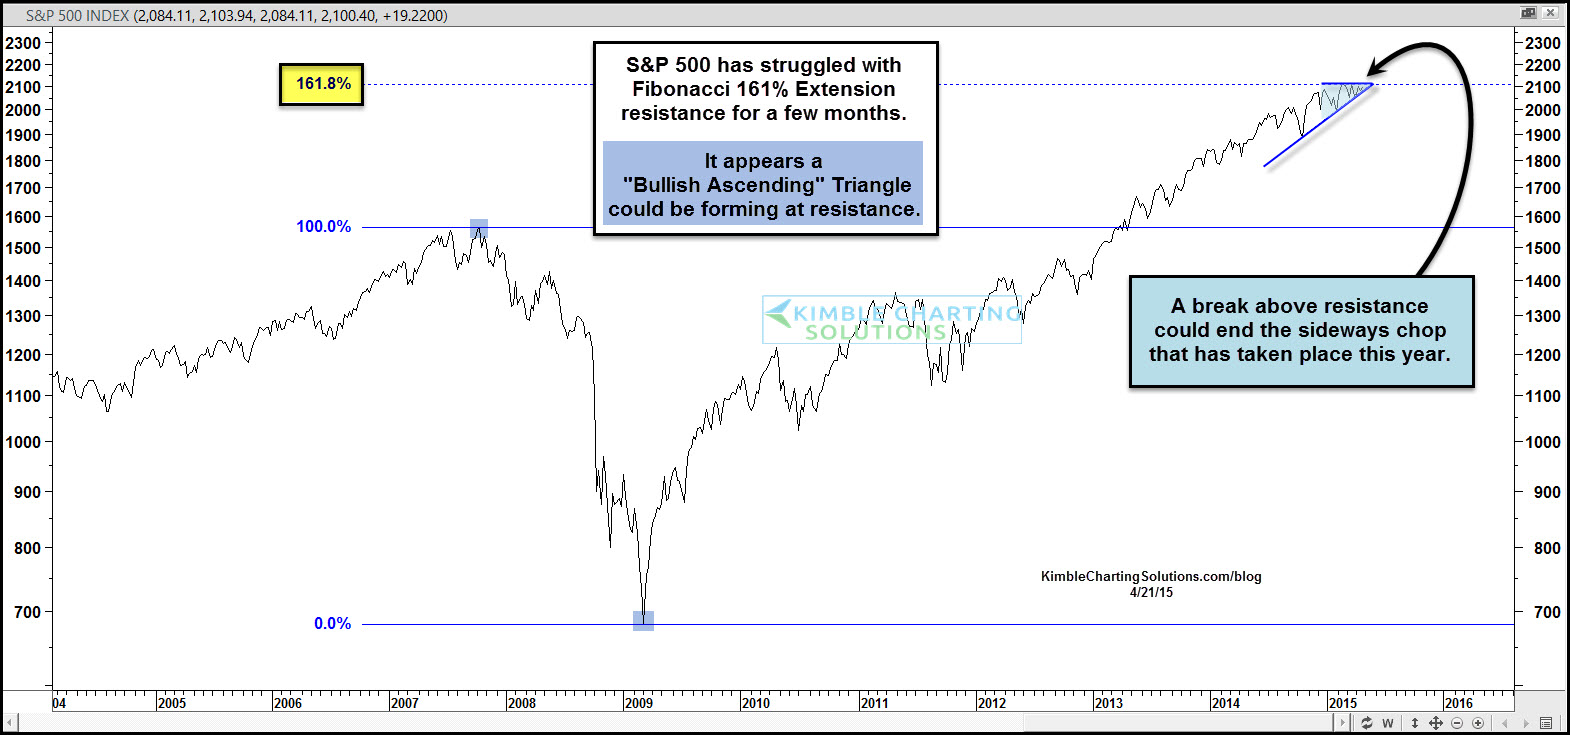
The chart below looks a potential bullish pattern in the S&P 500.
The S&P 500 has been like a rocking chair this year, keeping people busy, going nowhere. A potential bullish ascending triangle pattern could be forming with the top of the pattern being Fibonacci 161% Extension level resistance. A push above resistance would be a positive price message for the S&P 500.
Should the S&P 500 break support, sellers might step forward in S&P 500, Hog and Cattle at the same time. Keep a close eye on this trio, it could be important for where each will be a few months from now.


