The correction in price has ended, juniors are recovering, and Silver is leading. This has led to some renewed excitement amongst the faithful.
But the sector has not broken out yet, and other than the junior silver stocks, (NYSE:SILJ), is not close to a breakout point.
A vertical move typically entails some type of breakout. Let’s see how close the various markets are and evaluate the prognosis for a vertical move in 2021.
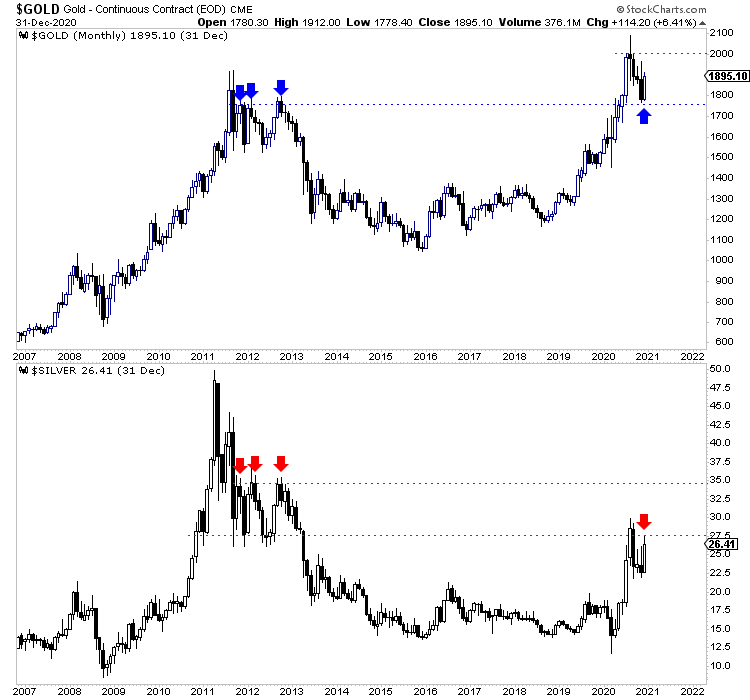
We plot the monthly candle charts for Gold and Silver below.
Interestingly, while Silver has been outperforming Gold, the latter is closer to starting a vertical move. A monthly close in Gold above $2000/oz could trigger the start of a vertical move.
Silver’s daily chart shows if Silver can close above the August 2020 high, then it has the potential for a measured upside move to $36. Silver faces stiff monthly resistance at both $27-$28 and $35-$36.
Silver needs a monthly close above $35 or a quarterly close above $37 to start a vertical move.

The metals have a way to go before they have a shot at breaking past $2000/oz and $35-$37/oz.
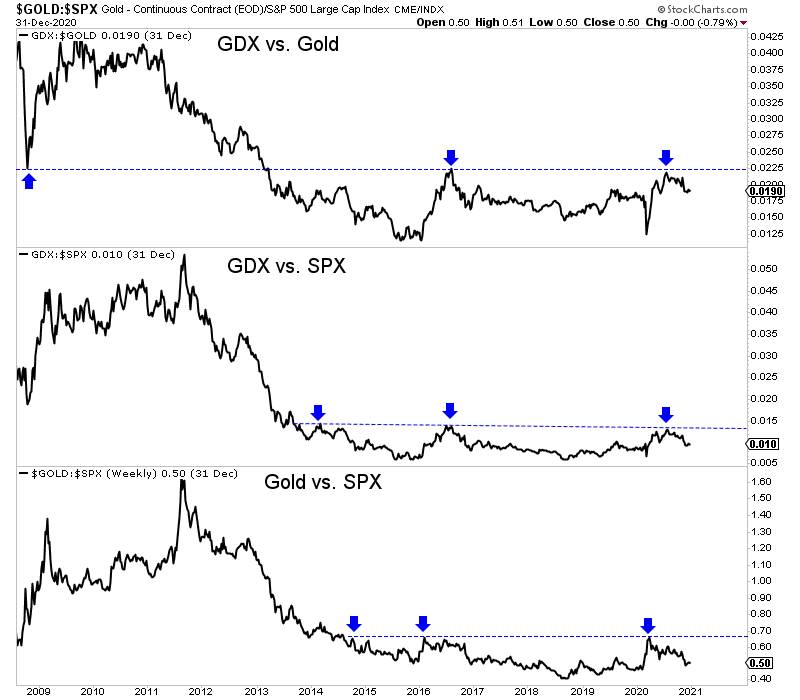
Also, they will not begin a vertical move until they perform better in real terms.
The ratios below will give us a better idea of the timing of that vertical move. It will likely coincide with breakout moves in the following ratios. As you can see, the recent trend is down, and a breakout is not imminent.

The miners could provide leadership for that next vertical move and specifically the juniors.
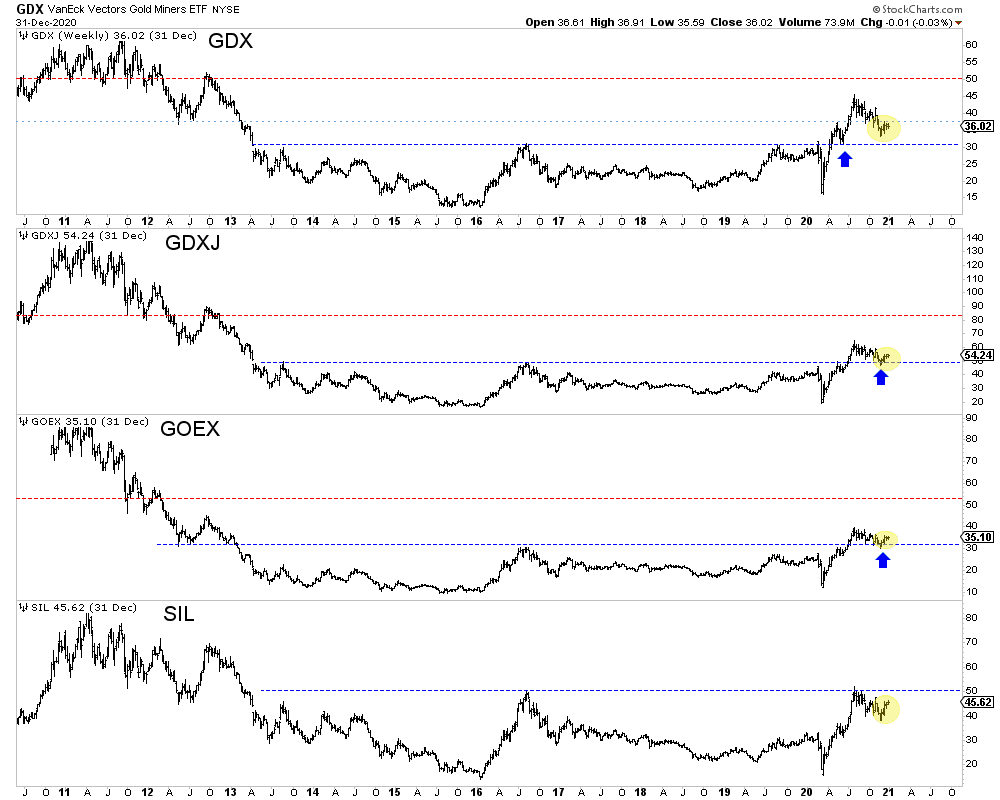
We already noted SILJ as the strongest. In the chart below, we plot the VanEck Vectors Gold Miners ETF (NYSE:GDX), VanEck Vectors Junior Gold Miners ETF (NYSE:GDXJ), Global X Gold Explorers ETF (NYSE:GOEX), and Global X Silver Miners ETF (NYSE:SIL), along with the S&P 500.
GOEX (explorers ETF) and GDXJ are closer to their August 2020 peaks than GDX (large miners), and so is SIL.

The miners (ex GDX) are closer to their 2020 peaks than the metals, and perhaps that is an early indication that they would lead the next leg higher. However, this move does not appear imminent.
The miners have to continue to emerge from their corrective lows and build momentum before they can retest their August 2020 highs.
Even if that happens, there’s no guarantee that they would break the August 2020 highs on the first try. They could fail to break out but consolidate bullishly for a few months or even longer.
An additional factor is the potential for the oversold US Dollar Index to rebound from long-term support at 88.
Ultimately, the weight of the evidence currently argues that if a vertical move was to begin in 2021, it might be six to twelve months away from starting.
The good news is that the downside potential for the miners and juniors at present is relatively limited, and there is plenty of value to be had.
