Central banks across the globe have acquired $1.5 trillion in assets through the first five months of 2017. The monthly amount ($300 billion) has found its way into virtually every cranny and nook of the financial system. U.S. stocks, European stocks, emerging market equities, higher yielding junk bonds, convertibles, preferred shares, real estate investment trusts, real estate – you name it. Values have continued to climb in spite of inadequate economic growth.
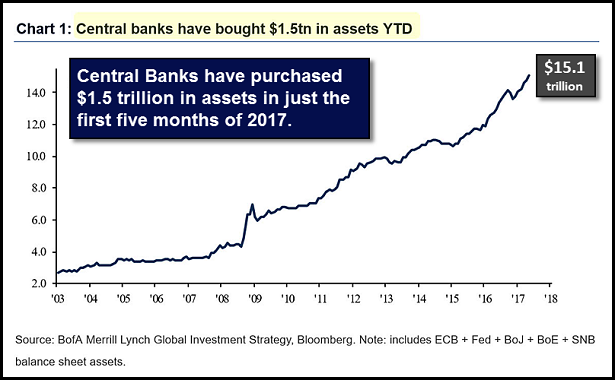
When a central bank buys assets with electronically printed currency credits, something of value (asset) is being exchanged for something that does not have value (electronic credit). Investors tend to view the policy intervention(s) favorably. And yet, the question that few are addressing is whether or not monetary policy makers (e.g., Federal Reserve, Bank of Japan, Bank of England, European Central Bank, etc.) can add electronic currency equivalents to the financial system without adverse consequences.
For example, one supposed benefit of central bank intervention, at least by the Federal Reserve, is greater U.S. household net worth. Nearly $95 trillion at the latest count. Record-breaking household wealth sounds like a wonderful occurrence. We are wealthier than ever, right? Household net worth to GDP, however, is extremely elevated at 498%. It did not get this high in the tech wreck (446%); it did not reach the current peak during the housing bust (471%).
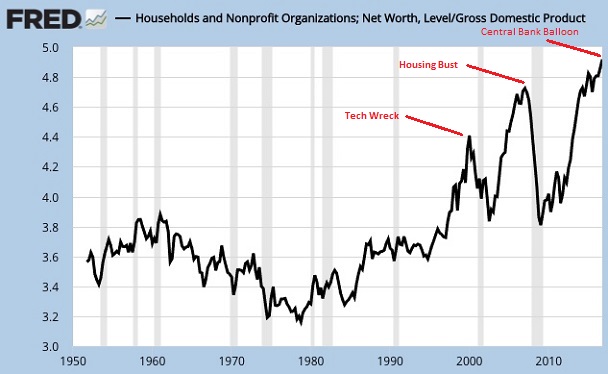
It follows that a negative consequence of manipulating interest rates lower with traditional rate cutting activity and/or with unconventional asset purchases is the likelihood of wealth destruction. Specifically, household net worth is likely to drop precipitously.
Keep in mind, prior to the mid-1990s, household net worth to GDP remained within a standard deviation of its average (360%). However, easy money policies by Federal Reserve chairs (i.e., Greenspan, Bernanke, Yellen) since the mid-1990s did more than spawn rapid wealth creation. It eventually led to agonizing wealth decimation.
What about the corporate sector? Hasn’t the addition of $15 trillion in global electronic currency equivalents ultimately made corporations stronger? Not exactly. Corporate stock shares are worth more than ever… yes. Yet in the U.S., business debt as a percentage of GDP has never been higher.
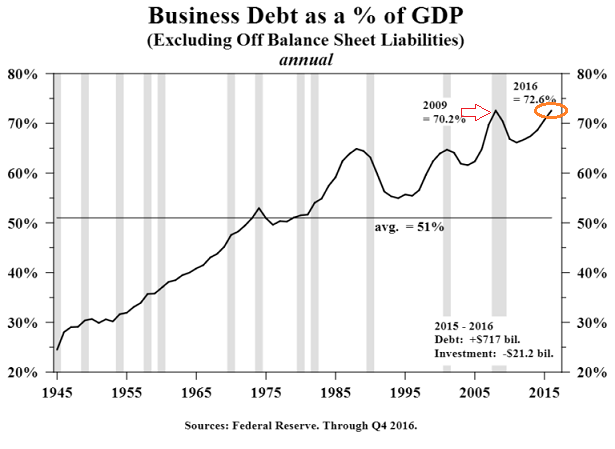
The first reaction that naysayers have to excessive corporate leverage is that it does not matter. Why not? Because interest rates are so low, companies have little trouble servicing those interest payments.
Unfortunately, this line of thinking misses on several fronts. First, interest coverage ratios have already deteriorated to levels not seen since 2009. That means the ability to service business debt is not quite as rosy as one might think. Second, borrowing costs for corporations may not be as favorable when debts need to be rolled over into new obligations in the future. Third, corporate leverage is reaching ominous levels. In fact, total net debt-to-total earnings (EBITDA) is higher than it was in the tech collapse (2002) or the financial crisis (2009).
There’s a fourth factor. Year-over-year tax receipts are down roughly 10%. Why might year-over-year corporate tax collections be telling? The cyclical indicator has turned downward prior to every recession since World War II.
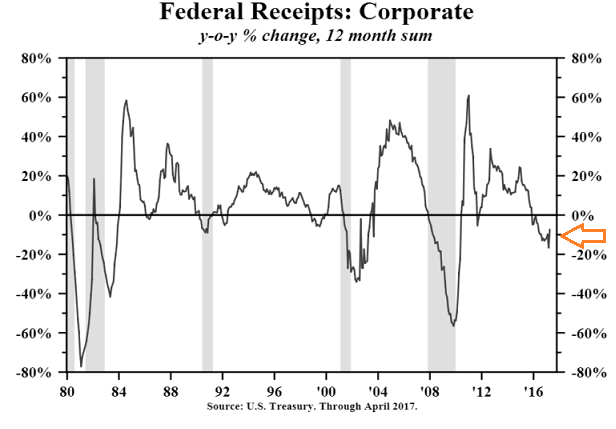
Granted, households and corporations have seen near-term fortunes brighten due to central bank creativity. As time marches on, though, should investors ignore the signs of ugly aftershocks?
“Come on, Gary,” you say. “Gross domestic product (GDP) is stable. The Fed just raised its overnight lending rate to 1.0%.” Yes, they did. And the 10-year yield is now down to 2.13% — its lowest level since shortly after the election. Why? Because the bond market believes the economy is weakening, not strengthening.
Truth be told, the electronic money printing and rate manipulating is likely a hindrance to GDP growth. The current U.S. expansion (5/09-Present) is averaging 1.9%-2.0%. That represents the weakest economic expansion in U.S. history. Over the last 10 years? About the same 1.3% that occurred in the 1930s.
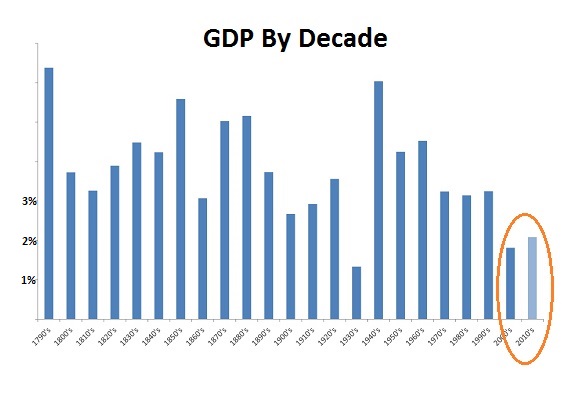
“Wait a minute, Gary,” you protest. “You cannot consider a 10-year assessment of economic growth (2007-2016) that contains the Great Recession.” Why not? The decade of the 1930s (1930-1939) incorporates the Great Depression. What’s more, recessions occur in nearly any 10-year period of American history.
Whether I include 2007 and 2008, or exclude them from analysis, the song remains the same. Our economy (GDP) is growing at a fraction of the rate that credit (a.k.a. “debt”) grows at.
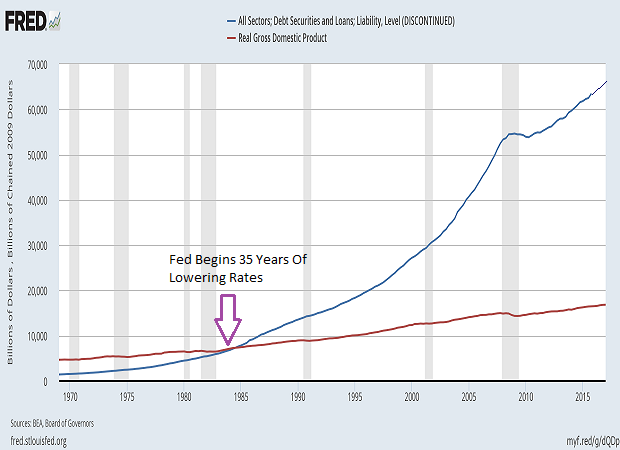
Households, corporations and government may be able to service low interest rates today. Asset prices may be at record highs. Yet there are going to be repercussions from central bank actions to lower borrowing costs and inflate asset prices. Every balloon does not burst, but they all deflate.
Bill Gross may have said it best at the Bloomberg Invest New York summit. He said, “Instead of buying low and selling high, you’re buying high and crossing your fingers.” Indeed, the price one pays determines one’s future return. Consider having a little less S&P 500 exposure and a little more cash on hand for future opportunity.
Disclosure Statement: ETF Expert is a web log (“blog”) that makes the world of ETFs easier to understand. Gary Gordon, MS, CFP is the president of Pacific Park Financial, Inc., a Registered Investment Adviser with the SEC. Gary Gordon, Pacific Park Financial, Inc., and/or its clients may hold positions in the ETFs, mutual funds, and/or any investment asset mentioned above. The commentary does not constitute individualized investment advice. The opinions offered herein are not personalized recommendations to buy, sell or hold securities. At times, issuers of exchange-traded products compensate Pacific Park Financial, Inc. or its subsidiaries for advertising at the ETF Expert website. ETF Expert content is created independently of any advertising relationship.
