Betting against Warren Buffett is usually a bad idea. But that’s exactly what one legendary hedge fund manager is planning to do... and that bet just might be a very good idea.
We wrote last week about the “Buffett Indicator,” which measures the ratio of U.S. stock market capitalization to U.S. GDP.
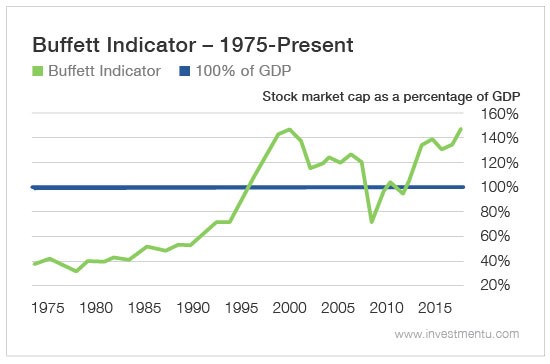
According to this ratio, U.S. stocks are trading at their highest valuation of the last 68 years. Despite this fact, Warren Buffett is offering to wager that buying U.S. stocks today will produce a better investment result than buying an index of hedge funds.
The man would appear to be betting against the indicator that bears his name... and against history, as shown in today’s chart. Perhaps that’s why the legendary hedge fund manager Mark Yusko jumped at the chance to accept Buffett’s wager.
I expect Yusko to win this one!
From Extremely Expensive to Super Extremely Expensive
Apparently, Buffett now believes that stock valuations will increase from extremely expensive to super extremely expensive.
That is literally the bet he is making... and that bet is dripping in irony.
“Buying low” is a big part of the reason why Warren Buffett is a billionaire. Throughout his career, he has not only identified excellent companies over and over again; he has also identified excellent moments to invest in those excellent companies over and over again.
He invested opportunistically. He “bought low.”
Given that history, and the fact that U.S. stocks are richly priced, Buffett’s newest wager is a bit of a headscratcher... and so is this comment he made on CNBC last week: “[The S&P 500] will absolutely kill every one of the fund of funds [over the next 10 years].”
According to the Buffett Indicator, U.S. stocks have reached their richest valuation level of the last 68 years. Buffett did not invent this valuation gauge, he merely praised it publicly. Back in a 2001 interview in Fortune, Buffet lauded this indicator as the “the best single measure of where valuations stand at any given moment.”
It has been called the Buffet Indicator ever since.
According to this “big picture” valuation gauge, a stock market is relatively cheap whenever its market cap drops well below 100% of GDP. Conversely, a stock market is relatively expensive whenever its market cap climbs well above 100% of GDP.
At the stock market lows of 2009, for example, the market cap of all U.S. stocks plummeted to less than 60% of U.S. GDP. But today, the U.S. market cap totals a whopping 148% of U.S. GDP, which is more than double the average readings of the last 68 years. Today’s 148% reading is also the highest level this metric has ever reached during the last 68 years.
In other words, stocks ain’t cheap.

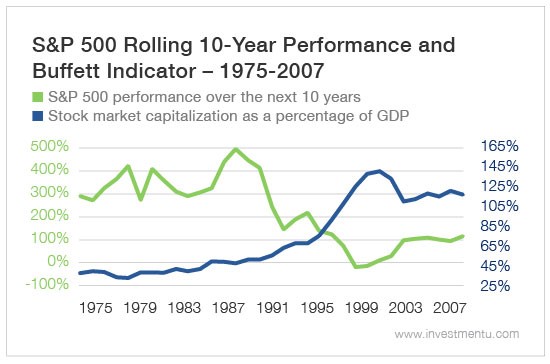
When stocks become this pricey, good things rarely happen. That’s a fact, as today’s chart illustrates. Each year on the chart displays two lines:
- The Buffett Indicator reading for that year
- The S&P 500’s total return during the following 10 years.
For example, in the chart at the top of this article, the blue line shows that in 1975, U.S. stocks were trading at 40% of U.S. GDP, while the green line shows that the S&P 500 delivered a total return of 282% during the ensuing 10 years (from 1975 to 1985).
Then there’s the other extreme. In 1998, U.S. stocks were trading at a lofty 131% of GDP. Over the next 10 years, the S&P 500 produced a loss of 13%. Think about that: After one entire decade of investment, the stock market turned $100 into $87!
Mark Yusko Hedges His Bet
Clearly, the starting price matters when making an investment. That’s why buying U.S. stocks at their current lofty valuations could be a risky bet... and why Yusko has a good chance of winning his wager with Buffett.
“It’s an important time in terms of the market cycle,” Yusko explains. “I think it’s important to be aware about the propensity of investors to chase hot returns at the peak of the cycle. It is a better time to get hedged."
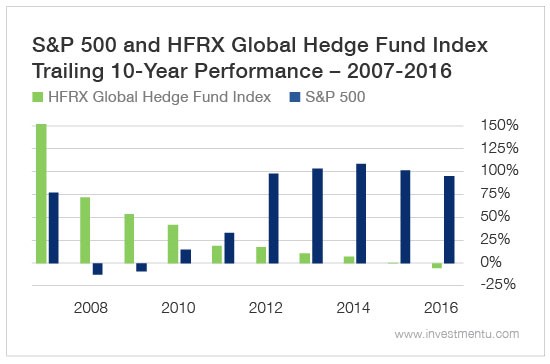
When stocks become pricey, hedging strategies tend to become more worthwhile. Recent history illustrates the point. Each year in the chart below shows the investment returns for the S&P 500 Index and for the Hedge Fund Research HFRX Global Hedge Fund Index during the preceding 10 years.
At the left side of the chart, we see years like 2008 and 2009 when the S&P 500 Index had produced losses during the previous 10-year periods. By contrast, in those years, the hedge fund index was showing sizable gains for the previous 10 years.

But as the new bull market launched in 2009 and continued to gain strength over the ensuing years, the S&P 500 Index chalked up hefty 10-year results. By contrast, the hedge funds index produced very meager results until it ultimately delivered a 10-year loss by the end of 2016.
But that was then and this is now. Today is probably the ideal moment to expect a major reversal of recent trends. It is a time to expect subpar returns from U.S. stocks and to reacquaint ourselves with the value of hedging... or at least with the value of caution.
Of course, even in a richly priced market, investors can identify outstanding opportunities. But at the same time, a richly valued market raises the risk profile of all investments, even outstanding ones.
Therefore, it is important to weigh the risks and proceed with caution... and maybe do a little hedging here and there.
