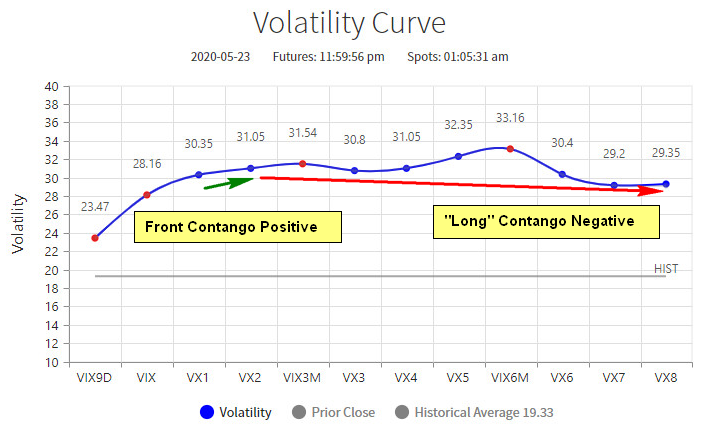
The VIX futures curve remains in what I call a “Bear Market Rally” formation. The front month contango between the 1st and 2nd VIX future is positive while the “long” contango between the 2nd and 8th VIX future remains negative.
In this case, the VIX futures market suggests that current volatility conditions are better than what we can expect during the summer which means that the current SPX rally may continue for a little while longer. However, higher VIX futures prices in the middle of the curve suggests more turbulence in the summer. The back of the VIX futures curve remains downward sloping which suggests that overall implied volatility levels remain very elevated compared to historical averages of about 20 which in turn means that we remain in a “bear market.”
Market participants are still struggling with a lot of uncertainty and are willing to pay up for hedges as the risk for additional corrections and air pockets remains very high.

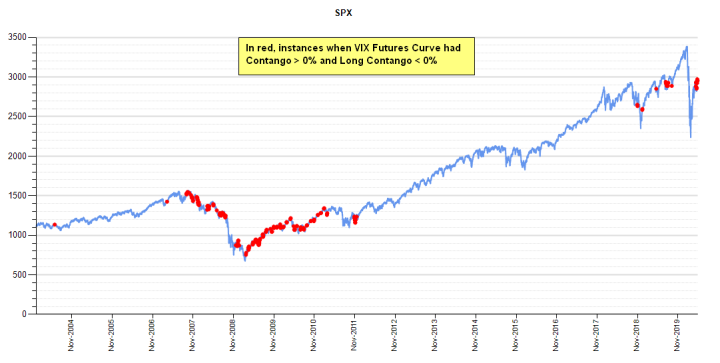
This is a formation that usually shows up after the market has established some form of a swing trade bottom and is in the process of recovering, re-establishing rotations and being more selective. The VIX futures curve has been in this “Bear Market Rally” formation only 5% of the time since 2004.
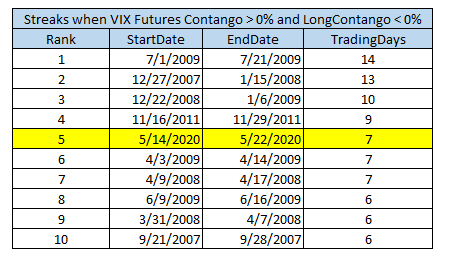
Most of the occurrences happened during the Financial Crisis in 2008 and 2009. This formation could be found as the SPX failed to recover many times ahead of the Lehman collapse and could also be found during the successful recovery years of 2009 and 2010. We are currently on a 7 trading day streak which ranks as the 5th longest.
A couple of the streaks that were longer happened in the winter of 2007 and 2008 right before big selloffs in the early spring of those years. This formation can’t tell us whether this Bear Market has “bottomed” or not. It did appear BEFORE Lehman and BEFORE the final flush in 2009.
What it does tell us, however, is that in whichever direction the market turns next, it is likely to last for a while and thus if you are on the opposite side of the trade and losing money, you have to have very little conviction. Holding on to longs could be a very bad idea as the market may offer significantly cheaper prices in the future since any drop has the potential to turn into a major selloff.
Buying the dip may very well turn into catching a falling knife like in March. At the same time, if you want to short the market you need to keep in mind that this type of formation has been seen during some very vicious rallies of the 30% variety in 2009. Whatever your opinion of this market is, make sure that you aren’t stubborn and double down if your trade is in the red. It will cost you dearly.
Flexibility and an open mind are more important now than is usually the case. Keep your stops tight and your conviction low.


