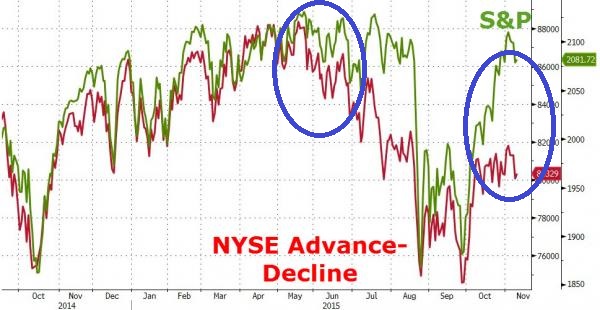
Some things go unnoticed. For example, the S&P 500 rallied 13% off its closing lows (1867) set in late August. Lost in the shuffle? The popular benchmark has yet to revisit its closing highs (2130) registered back in May.
In essence, the corrective activity that began in the springtime as a function of a faltering global economy, overvalued equities and weakening market internals has yet to run its course. What’s more, these factors that led to the August-September sell-off in risk assets are unlikely to dissipate quickly.
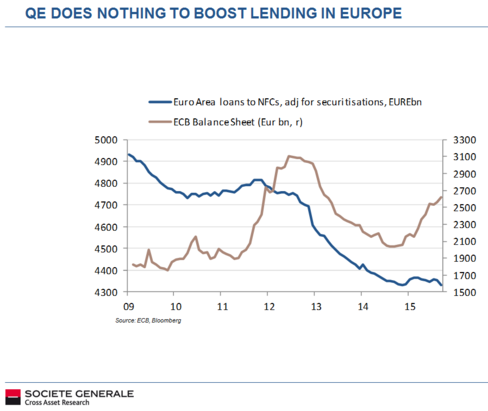
Let’s start with the macro-economic backdrop. Data show that quantitative easing (QE) in Europe is not stimulating borrowing activity the way that it stimulated borrowing activity in the United States. If European consumers and European businesses are fearful to take out loans – or if creditors are unwilling to extend credit – the euro-zone economy is unlikely to show improvement. Similarly, European stocks would not experience much of a boost from share buybacks.
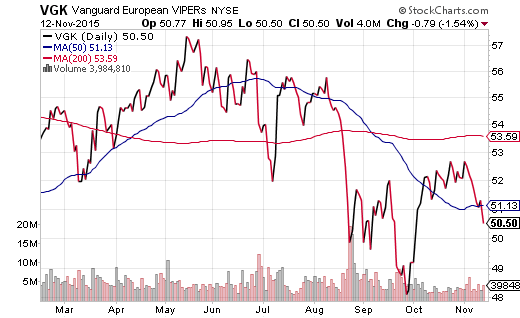
Not surprisingly, then, the Vanguard FTSE Europe (N:VGK) failed to rise above its 200-day moving average; it never came close to recapturing its 52-week high. At this moment, the euro-zone proxy is still 12% below its high-water mark.
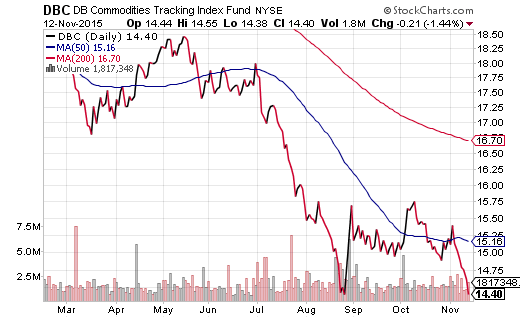
Europe is hardly the only canker sore on the world stage. Japan recently revised its economic growth projections lower. China is slowing dramatically. And nations that depend upon natural resources exports (e.g., Australia, Canada, Brazil, Chile, etc.) are witnessing yet another downturn in commodity prices. In fact, the PowerShares DB Commodity Tracking (N:DBC) has plummeted back to levels not seen since the late August free-fall for U.S. stocks.
The bullish case for U.S. stocks continues to rely on the notion that the rest of the world does not matter. Ironically, the Federal Reserve did not raise borrowing costs in September and cast doubt on any rate hike this year when it stated that “…global economic and financial developments may restrain economic activity.” The central bank subsequently backtracked at its October meeting by removing its commentary on global issues altogether.
So do the economic hardships abroad matter or not? They matter with respect to corporate earnings and revenue. Consider the reality that corporate profits as well as sales were negative for the recent quarter (Q3) and that multinationals with greater overseas exposure witnessed steeper year-over-year declines.
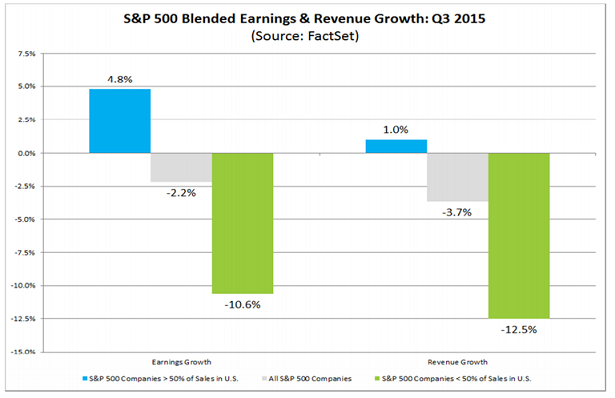
Clearly, the global economic slowdown remains a headwind for U.S. stocks. What’s more, declining earnings and declining revenue continue to pressure U.S. stock valuations. We are now looking at a price-to-sales ratio of 1.84 – one of the highest P/S ratios on record.
The third component that sent stocks tumbling back in August was the softening of market internals. In particular, the discrepancy between the S&P 500’s Advance-Decline (A/D) Line and that of the NYSE Composite pointed to fewer and fewer large companies holding up the benchmark. Here in November, the disparity appears to have resurfaced.
Some researchers have been particularly outspoken on the lack of market breadth. Heading into the current week of trading, Strategas Research Partners noted that “the 10 largest stocks in the S&P 500 have contributed more than 100% of the year’s roughly 2% gain.” They added that “the 10 biggest stocks in the index accounted for just 19% of the gains last year and 15.2% of the index’s return in 2013.”
We should let the above data sink in for a moment. In 2013 as well as 2014, the S&P 500’s appreciation was attributable to most of its components. In 2015? Only the 10 biggest large-caps account for the positive spin.
It gets worse. The same canaries in the investment mines that stopped serenading last summer – high yield junk bonds, emerging market stocks, small company stocks, commodities – are straining their vocal chords once again. The iShares iBoxx $ High Yield Corporate Bond (N:HYG) appears destined to retest its 52-week lows in the same way that commodities via DBC have.
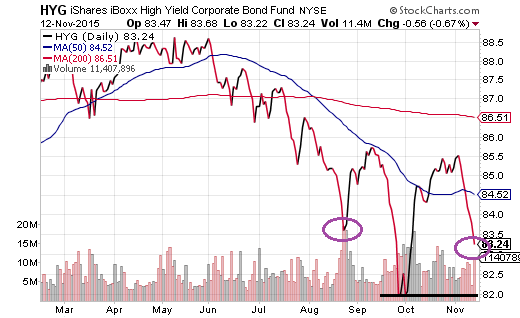
In sum, the S&P 500 has never fully recovered because global economic headwinds, equity overvaluation and anemic market breadth remain. Transporters, industrials, energy, materials, retail, leisure, household products, utilities, real estate, media, healthcare – a wide variety of sectors and sub-sectors have been buckling. It follows that it should not be all that surprising to see the S&P 500 buckle as well.
Disclosure: Gary Gordon, MS, CFP is the president of Pacific Park Financial, Inc., a Registered Investment Adviser with the SEC. Gary Gordon, Pacific Park Financial, Inc, and/or its clients may hold positions in the ETFs, mutual funds, and/or any investment asset mentioned above. The commentary does not constitute individualized investment advice. The opinions offered herein are not personalized recommendations to buy, sell or hold securities. At times, issuers of exchange-traded products compensate Pacific Park Financial, Inc. or its subsidiaries for advertising at the ETF Expert web site. ETF Expert content is created independently of any advertising relationships.

