I recently wrote a piece that was widely read called “Why You Should Not Underestimate The Severity Of The Coming Recession.” In that piece, I argued that the odds of a recession in the not-too-distant future were increasing rapidly and that mainstream economists are incorrect for assuming that it will be a mere ebb of the business cycle rather than a more powerful economic crisis like we experienced in 2008 or even worse. The reason why I am worried about a much more powerful than usual recession is because of the tremendous risks – namely bubbles and debt – that have built up globally in the past decade due to ultra-stimulative central bank policies. In the current piece, I will argue that the probability of a recession in the next year is likely even higher than indicated by the popular New York Fed recession probability model that many economists follow.
According to the New York Fed’s recession probability model, there is a 30% probability of a U.S. recession in the next 12 months. The last time that recession odds were the same as they are now was in July 2007, which was just five months before the Great Recession officially started in December 2007. July 2007 was also notable because that is when Bear Stearns’ two subprime hedge funds lost nearly all of their value, which ultimately contributed to the investment bank’s demise and the sharp escalation of the U.S. financial crisis.
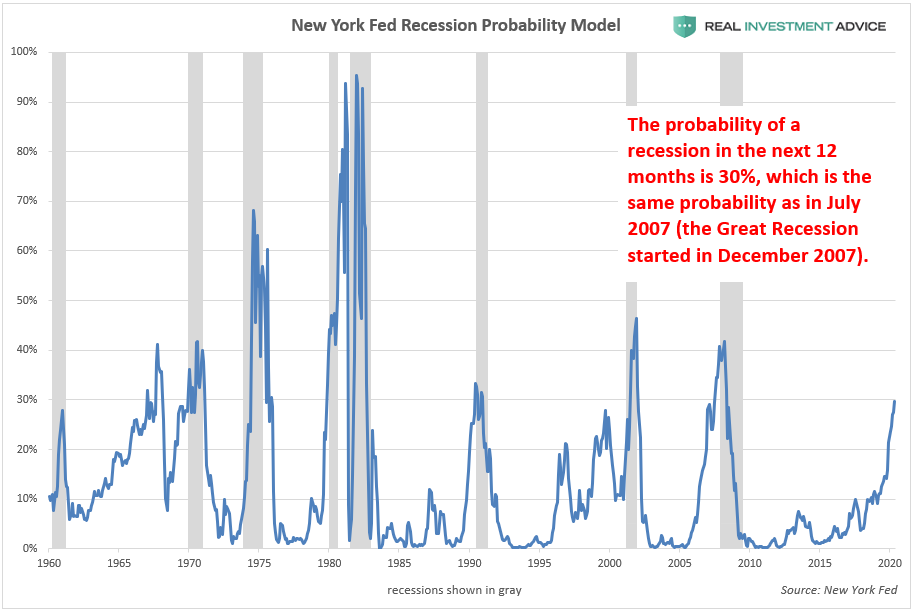
Many bullishly-biased commentators are trying to downplay the warning currently being given by the New York Fed’s recession probability model, essentially saying “So? There is only a 30% chance of a recession in the next year, which means that there is a 70% chance that there won’t be a recession in the next year!” The reality is that, as valuable as this model is, it has greatly underestimated the probability of recessions since the mid-1980s. For example, this model only gave a 33% probability of a recession in July 1990, which is when the early 1990s recession started. It only gave a 21% probability of a recession in March 2001, which is when the early-2000s recession started. It also only gave a 39% probability of a recession in December 2007, which is when the Great Recession started.
The New York Fed’s recession probability model has underestimated the probability of recessions in the past three decades because it is skewed by the anomalous recessions of the early-1980s. The New York Fed’s model is based on the Treasury yield curve, which is based on U.S. interest rates. The early-1980s recessions were anomalous because they occurred as a result of Fed Chair Paul Volcker’s unusually aggressive interest rate hikes that were meant to “break the back of inflation.” I have found that only considering New York Fed recession probability model data after 1985, and normalizing that data so that the highest reading during that time period is set to 100%, gives more accurate estimates of recession probabilities in the past three decades. For example, this methodology warned that there was an 85% chance of a recession in December 2007, when the Great Recession officially started (the standard model only gave a 39% probability). This methodology is warning that there is a 64% chance of a recession in the next 12 months, which is quite alarming.
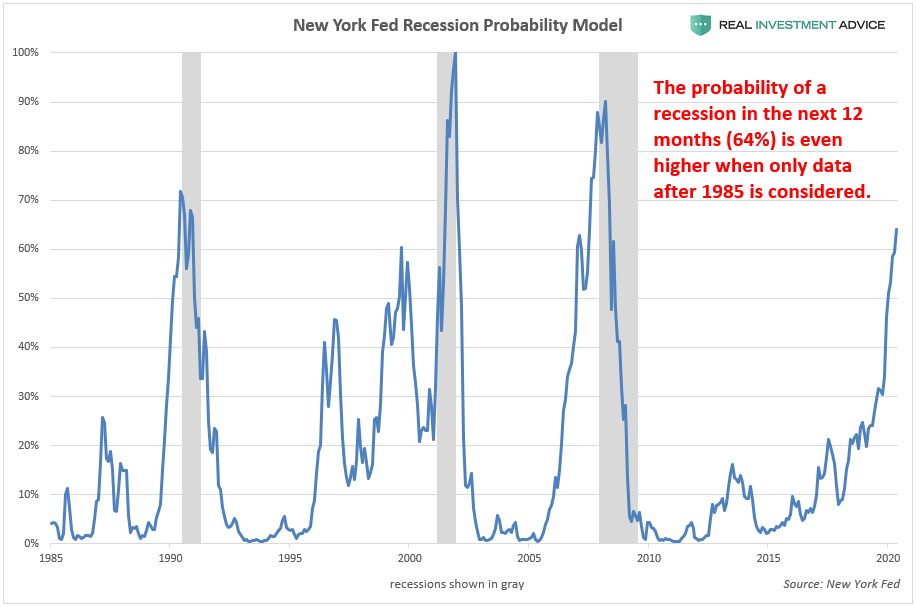
The reason why a two-thirds chance of a recession in the next year is so alarming is because the next recession is not likely to be a garden-variety recession or a mere ebb of the business cycle, as I explained two weeks ago. Not only has global debt increased by $70 trillion since 2008, but scores of dangerous new bubbles have inflated in the past decade thanks to ultra-low interest rates and quantitative easing programs. These bubbles are forming in global debt, China, Hong Kong, Singapore, emerging markets, Canada, Australia, New Zealand, European real estate, the art market, U.S. stocks, U.S. household wealth, corporate debt, leveraged loans, U.S. student loans, U.S. auto loans, tech startups, shale energy, global skyscraper construction, U.S. commercial real estate, the U.S. restaurant industry, U.S. healthcare, and U.S. housing once again. I believe that the coming recession is likely to be caused by (and will contribute to) the bursting of those bubbles.
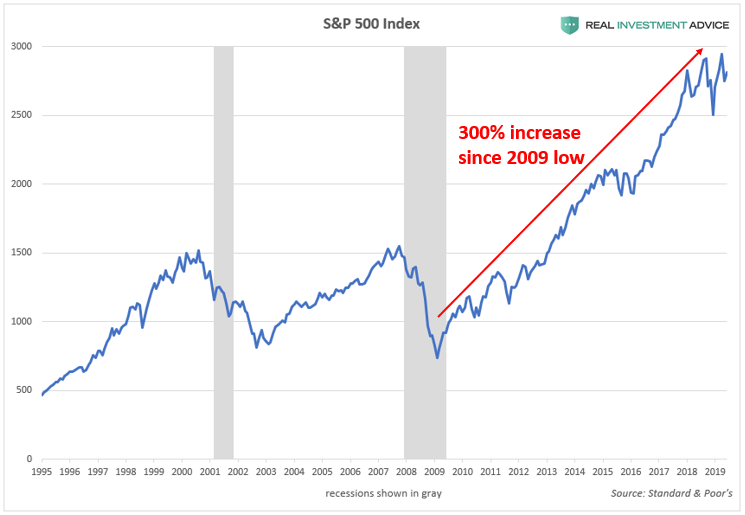
For example, one of the most obvious bubbles is forming in the U.S. stock market. The U.S. stock market (as measured by the S&P 500) surged 300% higher in the past decade:
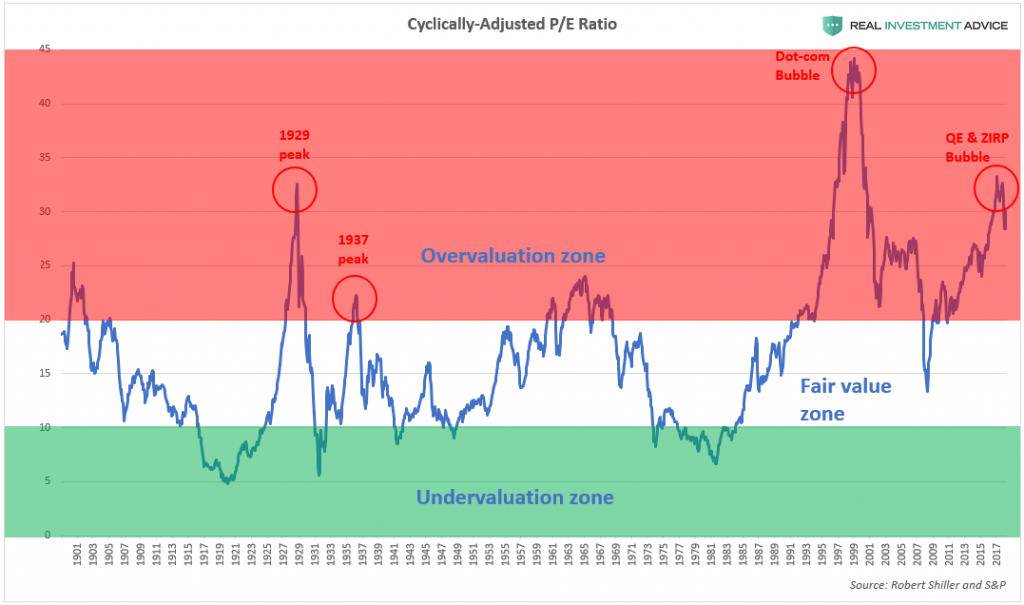
The Fed’s aggressive inflation of the U.S. stock market caused stocks to rise at a faster rate than their underlying earnings, which means that the market is extremely overvalued right now. Whenever the market becomes extremely overvalued, it’s just a matter of time before the market falls to a more reasonable valuation again. As the chart below shows, the U.S. stock market is nearly as overvalued as it was in 1929, right before the stock market crash that led to the Great Depression.
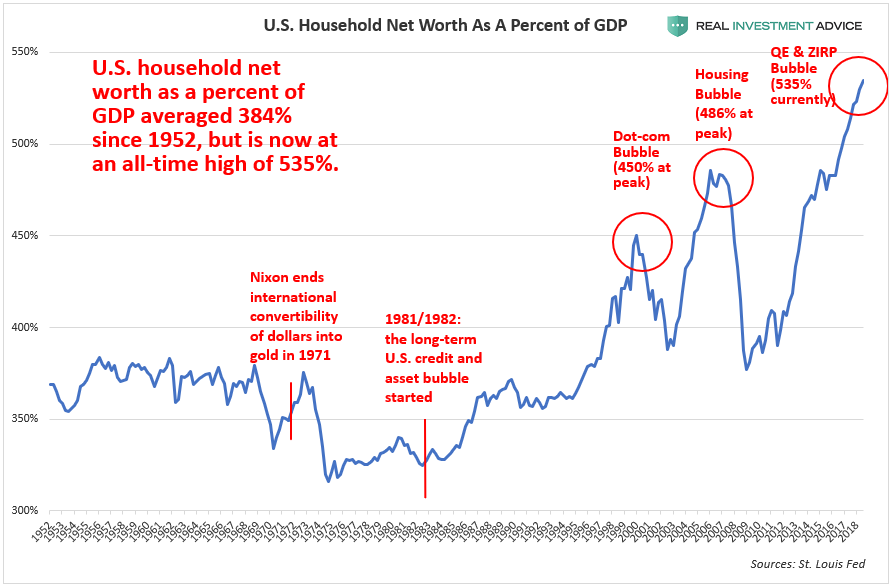
The Fed’s aggressive inflation of U.S. stocks, bonds, and housing prices has created a massive bubble in household wealth. U.S. household wealth is extremely inflated relative to the GDP: since 1952, household wealth has averaged 384% of the GDP, so the current bubble’s 535% figure is in rarefied territory. The dot-com bubble peaked with household wealth hitting 450% of GDP, while household wealth reached 486% of GDP during the housing bubble. Unfortunately, the coming household wealth crash will be proportional to the run-up, which is why everyone should be terrified of the coming recession.
In addition, Goldman Sachs’ Bear Market Risk Indicator has been at its highest level since the early-1970s: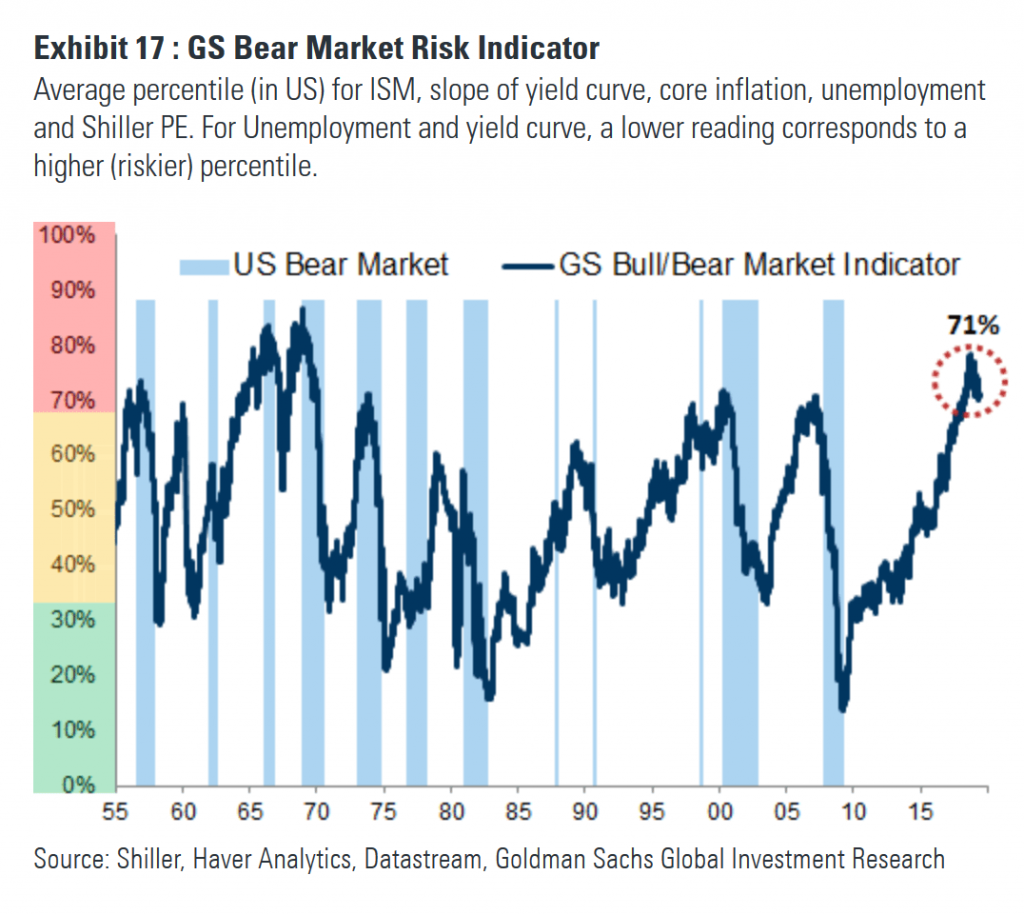
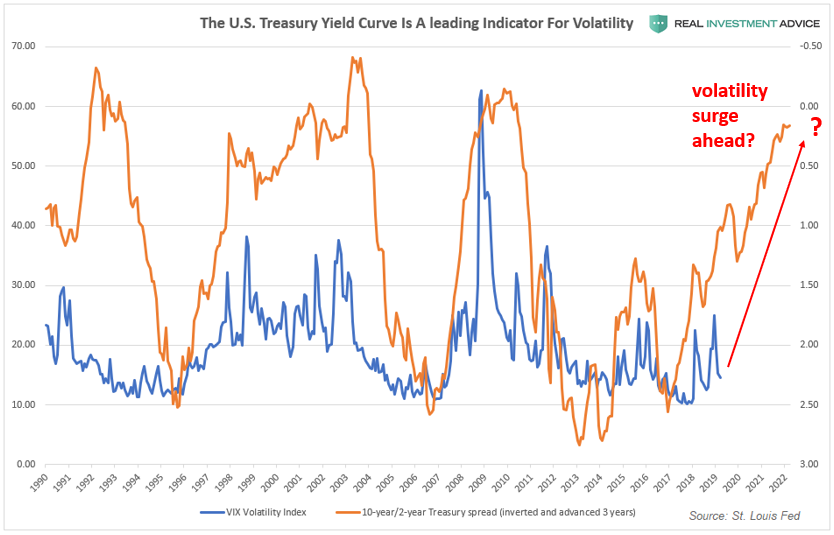
Another indicator that supports the “higher volatility ahead” thesis is the 10-year/2-year Treasury spread. When this spread is inverted (in this case, flipped on the chart), it leads the Volatility Index by approximately three years. If this historic relationship is still valid, we should prepare for much higher volatility over the next few years. A volatility surge of the magnitude suggested by the 10-year/2-year Treasury spread would likely be the result of a recession and a bursting of the massive asset bubble created by the Fed in the past decade.
The moral of the story is that nobody should be complacent in these times when recession risk is so high, especially because the coming recession is likely to set off a global cluster bomb of dangerous bubbles and debt. The current probability of a recession is the same as it was during the Big Short heyday of 2007 when subprime was blowing up – just let that sink in for a minute. Do you think “this time will be different“? How can it be different when we didn’t learn from our mistakes and have continued binging on debt and inflating new bubbles?! Anyone who believes that “this time will be different” is seriously delusional and will be taught a very tough lesson in the not-too-distant future.
