Investing.com’s stocks of the week
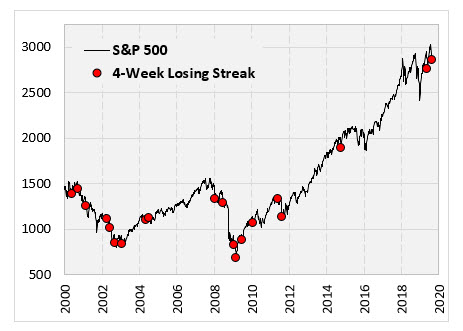
When I first realized that last week marked a four-week losing streak for the S&P 500 (SPX), it didn't strike me as that interesting. When I delved into it, though, a four-week losing streak is more uncommon than I thought. One happened earlier this year in May, but that was the first one in over four years. The chart below marks four-week S&P 500 losing streaks since 2010. This recent one is especially interesting, as it happened with stocks at an all-time high. Below, I explore how stocks have behaved after four-week losing streaks in the past, and I parse out the times they occurred at an all-time high. We'll see if these streaks have tended to be a pullback in a bull market, or the beginning of something bad.

What Happens After a 4-Week SPX Losing Streak
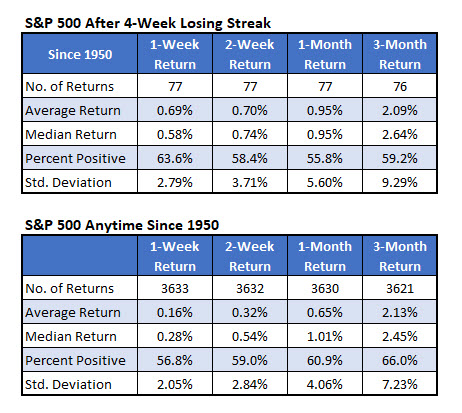
Going back to 1950, the first table below tells us how the S&P 500 has generally performed after four-week losing streaks. The second table below shows typical returns since then for comparison. There's a tendency for an initial bounce, as the index averages a 0.69% return one week after the four-week losing streak, compared to a typical weekly return of 0.16%. As time goes by, however, the returns look more and more like normal market returns. Based on this, if your time frame is anything other than very short term, whatever your strategy was before the losing streak, just stick to that.

Losing Streaks After S&P Hits New Highs
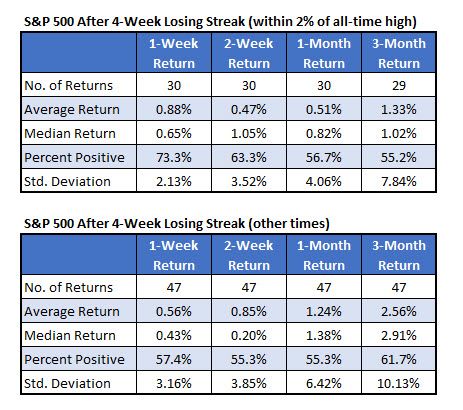
I broke down those 77 four-week losing streaks into when they occurred within 2% of an all-time high, versus other times. The results are interesting, and don't inspire hope. The initial bounce after the losing streak was stronger when stocks were close to an all-time high.
The bounce, however, is short-lived. When you go farther out, the returns have underperformed more and more. Three months after the losing streak when the index is near the all-time high, it has averaged a gain of 1.33%, with 55% of the returns positive. Other times, the index has averaged a gain of more than 2.5%, with 62% of the returns positive. The returns don't suggest anything catastrophic on the horizon, but there has been some underperformance.

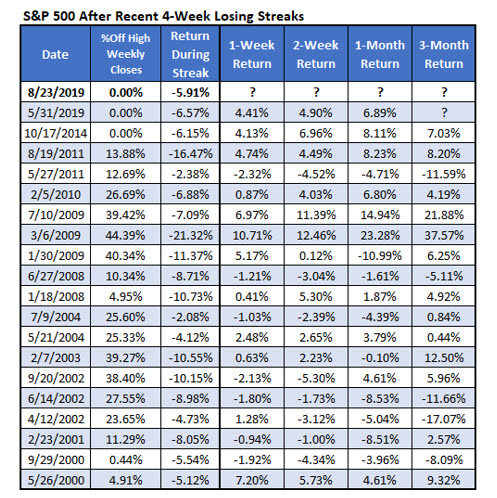
Finally, below is a list of the individual occurrences of these losing streaks. The last three occurrences, with two of them occurring with the index near an all-time high, have been very good buying opportunities. In each case, the S&P 500 gained anywhere from 6.89% to 8.23% over the next month.

