- Expectations for a withdrawal of 118 bcf
- Natural gas continued to grind lower
- A blow-off low is necessary to bring volatility back and inject fear
Natural gas continued its descent as the price moved below the $1.80 level over recent trading sessions. The price fell to its latest low of $1.753 per MMBtu on the active month March futures contract on February 11. The energy commodity attempted to consolidate between $1.80 and $1.90 since late January, but the overwhelmingly bearish sentiment in the market sent the price to a new low and the lowest price since March 2016. In 2016, the price dropped to a low of $1.611, the lowest price since 1998, when it traded only one tick lower at $1.61 per MMBtu. Natural gas appears to be steaming toward a test of those technical support levels. With only six weeks to go in the withdrawal season, the market has shifted into spring mode when the price tends to reach a seasonal low.
The Energy Information Administration provided little support for the price of natural gas when they released the latest inventory data on Thursday, February 13. The United States Natural Gas Fund (NYSE:UNG) moves higher and lower with the price of the nearby futures contract on NYMEX. These days, both have been on a one-way street to the downside.
As the chart highlights, stocks declined by 115 bcf at the end of last week. Inventories stood at 2.494 trillion cubic feet, 31.7% above last year’s level, and 9.4% above the five-year average for this time of the year. With only six weeks to go in the withdrawal season, stocks would need to decline by an average of 231.17 bcf over the coming weeks to reach last year’s end of season low at 1.107 tcf. As inventory declined tend to trail off at the end of the peak season for demand and the highest withdrawal so far this season was only 201 bcf, stocks will go into the injection season at a significantly higher level in 2020 than in 2019.

(Source: CQG)
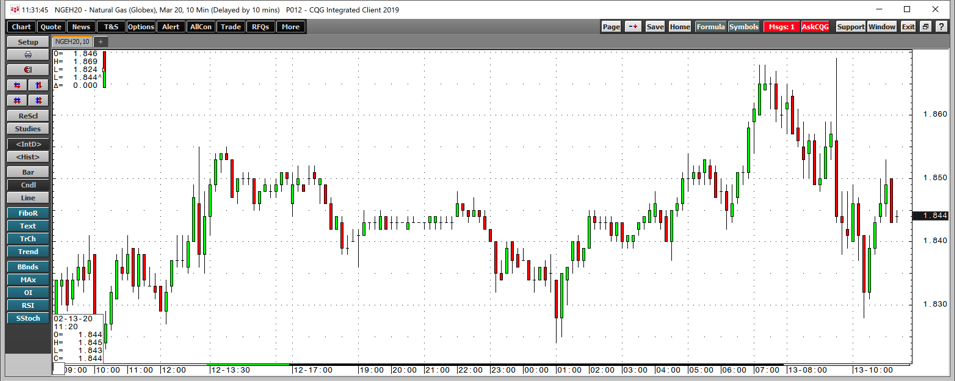
The 10-minute chart shows that the price initially moved a bit higher to a peak of $1.869 after Thursday’s data release but came back down to below the $1.85 level.
Natural Gas Continued To Grind Lower
Over the past week, the price of the energy commodity continued to make lower highs and lower lows.
The daily chart illustrates the steady decline since the high in early November. After making a new low at $1.753 on February 11, natural gas staged a bit of a comeback but has yet to challenge the first level of technical resistance at just over the $1.90 per MMBtu level. Price momentum and relative strength indicators turned higher after the latest bounce from new lows, but both metrics remain below neutral territory. The total number of open long and short positions fell from the latest high at 1.54 million contracts to 1.45 million, which was likely caused by profit-taking by those holding speculative short positions. Daily historical volatility rose from under 26% to over 34% as the daily trading ranges have increased over recent trading sessions.
A Blow-Off Low Is Necessary To Bring Volatility Vack And Inject Fear
The price pattern in the natural gas futures arena, together with the decline in open interest, are signs that any further attempt at a recovery is likely to attract a new wave of speculative selling. We may have to wait until March or April for the natural gas futures market to make a significant bottom. I expect that we will see a challenge of the March 2016 low.
A blow-off low to a new low and the lowest price in decades could be necessary to end the pattern of steady selling in the natural gas market. At the current price, producers are suffering, and a decline in output is likely. The price for natural gas for delivery in January 2021, when the energy commodity tends to peak, was below the $2.60 level on February 13.
Natural gas remains in oversold territory on long-term charts. The risk of a recovery will continue to rise with each new low. However, the odds favor even lower prices over the coming weeks as the bearish trend will continue to encourage selling on any rally.
The United States Natural Gas Fund L.P. (NYSE:UNG) was trading at $14.39 per share on Thursday afternoon, down $0.03 (-0.21%). Year-to-date, UNG has declined -38.29%, versus a 27.02% rise in the benchmark S&P 500 index during the same period.
UNG currently has an ETF Daily News SMART Grade of C (Neutral), and is ranked #51 of 109 ETFs in the Commodity ETFs category.
