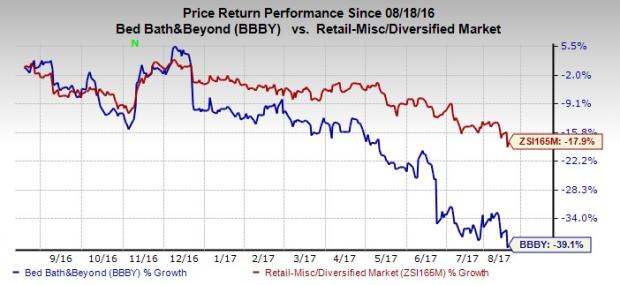
Leading specialty retailer, Bed Bath & Beyond Inc. (NASDAQ:BBBY) , has been losing popularity among investors. This Zacks Rank #5 (Strong Sell) stock plunged over 39% in the last one year, wider than the industry’s decline of 17.9%. Currently, the industry is placed at the bottom 2% of the Zacks classified industries (251 out of 256).

On the contrary, the broader Retail-Wholesale sector gained 10% and is placed at the bottom 6% of the Zacks classified sectors (15 out of 16).
What’s Giving Bed Bath & Beyond a Tough Time?
Dismal Performance
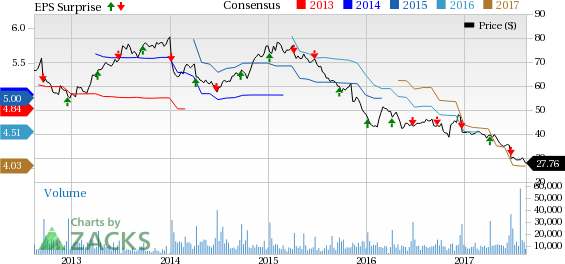
Bed Bath & Beyond has been putting up dismal results for quite some time now. Evidently, the company’s earnings have missed the Zacks Consensus Estimate in six of the last 10 quarters. Moreover, its top line has lagged the consensus mark in nine of the trailing 11 quarters. In fact, the trend continued in first-quarter fiscal 2017 too, wherein both its top line and bottom line lagged estimates. Also, earnings declined 27.5% on a year-over-year basis.
Notably, management retained its previously issued dismal bottom-line outlook for fiscal 2017, as it expects better visibility after the fiscal second quarter. Thus, the company continues to envision current-year earnings per share to decline in the range of low-single digits percentage to 10%.
Margins Remain Pressurized
Bed Bath & Beyond has also been grappling with soft margins for four quarters now. While the gross margin contracted 90 basis points (bps) in the fiscal first quarter, it declined 60 bps, 80 bps and 70 bps in the fourth, third and second quarters of fiscal 2016, respectively.
Moreover, decline in gross margin in the last quarter stemmed from higher direct-to-customer shipping expenses, alongside rise in coupon expense on account of increased redemptions. This, along with a rise in selling, general and administrative (SG&A) expenses caused operating margin to decrease 240 bps year over year, which marked the company’s fourth straight quarter of operating margin decline as well.
Going forward, the company continues to anticipate gross margin decline in fiscal 2017, alongside SG&A deleverage on account of payroll and payroll-related expenses as well as technology expenses.
Tough Retail Environment
With digital transformation in shopping and consumers splurging online, store and mall traffic has been hit hard. As a result, most retailers, including the big-box ones, are struggling to compete with eCommerce bigwigs like Amazon.com Inc. (NASDAQ:AMZN) and are being forced to trim store count to focus more on an online model.
We note that Bed Bath & Beyond has fallen prey to these retail headwinds, as the company has been reeling under sluggish mall traffic, which has been hurting its performance for quite some time. Also, increased net-direct-to-consumer shipping costs and higher coupon and advertising costs are hurting its results.
Management too stated that the company faced excess sluggishness in store transactions in the fiscal first quarter, along with greater costs. Comparable store sales (comps) fell 2% in the same quarter.
Other Headwinds
Owing to its exposure to international markets, Bed Bath & Beyond faces various risks associated with international operations, including legal and regulatory hurdles, changing global fashion trends and unfavorable currency fluctuations. Hence, persistence of these headwinds is likely to weigh on the company’s results in the near term.
Bottom Line
Though Bed Bath & Beyond is striving hard to spark a turnaround with strategic initiatives like eCommerce enhancement and improvement of customer services, the current dismal trends cannot be simply overlooked.
Stocks that Warrant a Look
A few better-ranked stocks in the same industry that are worth considering are Build-A-Bear Workshop, Inc. (NYSE:BBW) and Five Below, Inc. (NASDAQ:FIVE) carrying a Zacks Rank #2 (Buy). You can see the complete list of today’s Zacks #1 Rank (Strong Buy) stocks here.
Build-A-Bear Workshop, with a long-term earnings growth rate of 22.5% pulled off an average positive earnings surprise of 73.7% in the last four quarters.
Five Below, with a long-term earnings growth rate of 28.5% delivered an average positive earnings surprise of 6.3% in the last four quarters.
One Simple Trading Idea
Since 1988, the Zacks system has more than doubled the S&P 500 with an average gain of +25% per year. With compounding, rebalancing, and exclusive of fees, it can turn thousands into millions of dollars.
This proven stock-picking system is grounded on a single big idea that can be fortune shaping and life changing. You can apply it to your portfolio starting today.
Learn more >>
Amazon.com, Inc. (AMZN): Free Stock Analysis Report
Bed Bath & Beyond Inc. (BBBY): Free Stock Analysis Report
Build-A-Bear Workshop, Inc. (BBW): Free Stock Analysis Report
Five Below, Inc. (FIVE): Free Stock Analysis Report
Original post
Zacks Investment Research

