- Market expected withdrawal of 50 bcf for week ending November 15
- A feeble attempt at a rally following the EIA data
- The injection season ends with a peak of 3.732 tcf
In a sign that the winter season has arrived, the Energy Information Administration reported the first withdrawal from storage across the United States for the week ending on November 15.
The price action in the natural gas futures market leading into the latest inventory data had been bearish.

(Source: CQG)
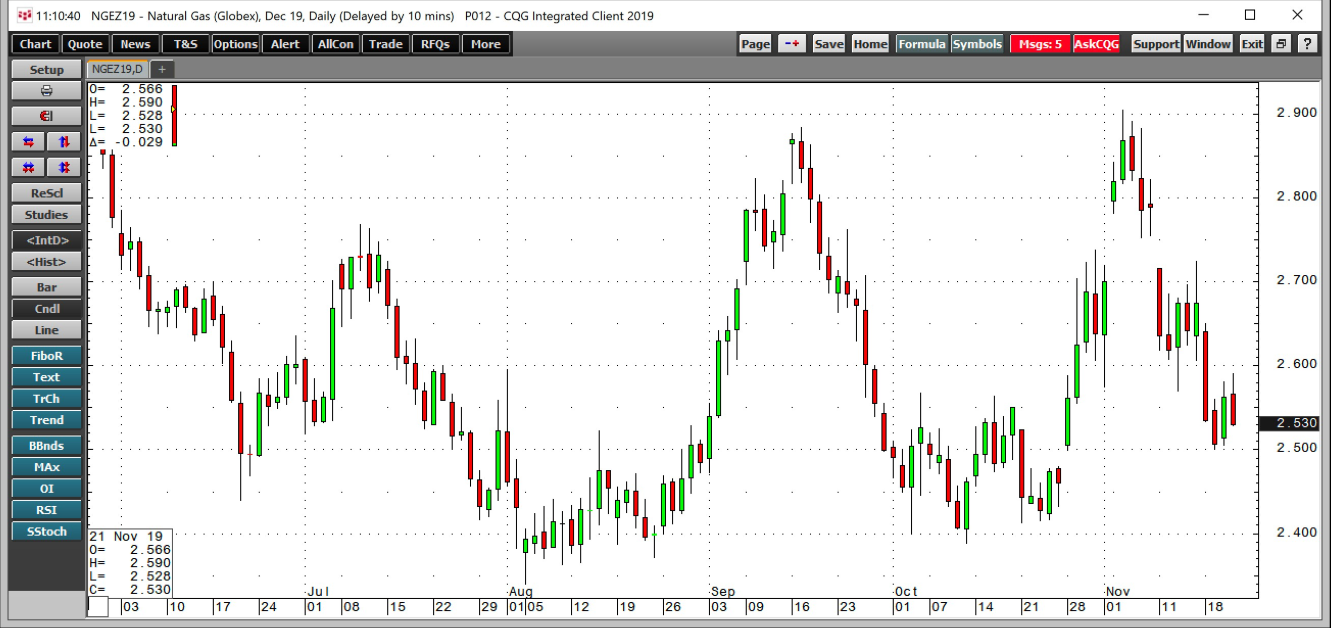
As the daily chart of the December NYMEX natural gas futures contract highlights, the price dropped from a high at $2.905 on November 5 to a low at $2.501 per MMBtu on November 19, a drop of 13.9% over the two weeks. The daily chart also developed a bearish island reversal pattern with a gap from $2.738 to $2.753. The chart formation has been a bearish factor for the price of the energy commodity since November 11. Natural gas had not been trading in winter mode over the recent weeks. The United States Natural Gas Fund (NYSE:UNG) moves higher and lower with the price of the energy commodity.
The Market Expected A Withdrawal Of 50 bcf For Week Ending November 15
The market had expected the first decline in inventories for the 2019/2020 peak season of demand on Thursday, November 21. The consensus estimate was for a withdrawal of around 50 billion cubic feet from stockpiles before the release of the data.

(Source: EIA)
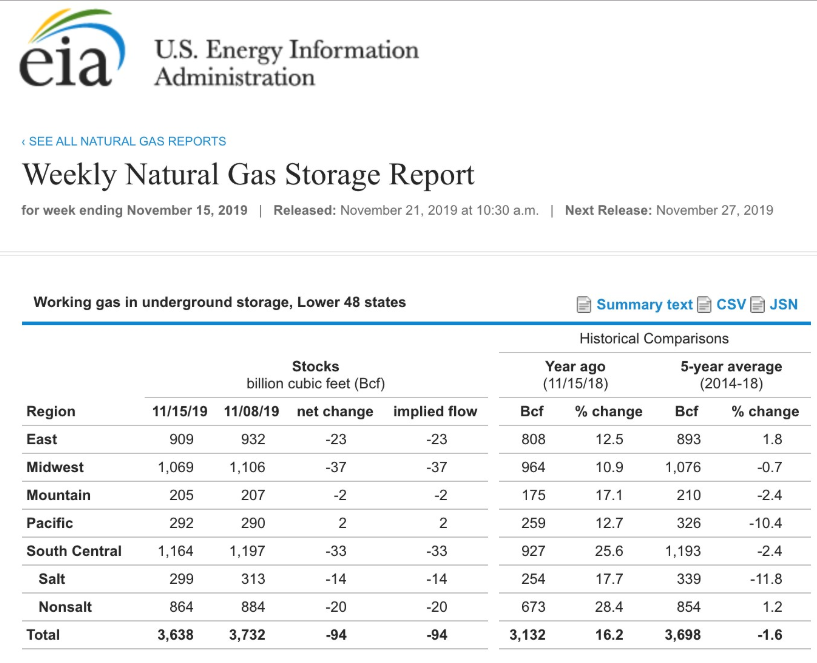
The chart shows that natural gas inventories fell by a higher than expected 94 billion cubic feet for the week ending on November 15, according to the Energy Information Administration. Total stocks were at 3.638 trillion cubic feet as of last Friday, with four months of declines ahead throughout the peak heating season. According to the EIA, the amount of natural gas in storage was 16.2% higher than last year at this time, but 1.6% below the five-year average for mid-November.
A Feeble Attempt At A Rally Following EIA Data
Natural gas was trading around the $2.55 per MMBtu level going into this week’s EIA inventory report. The price was trading a lot closer to the low than the high since November 5.
The EIA data was bullish as stocks dropped by almost double the level the market had expected. However, the reaction in the futures market was not at all bullish for the energy commodity.

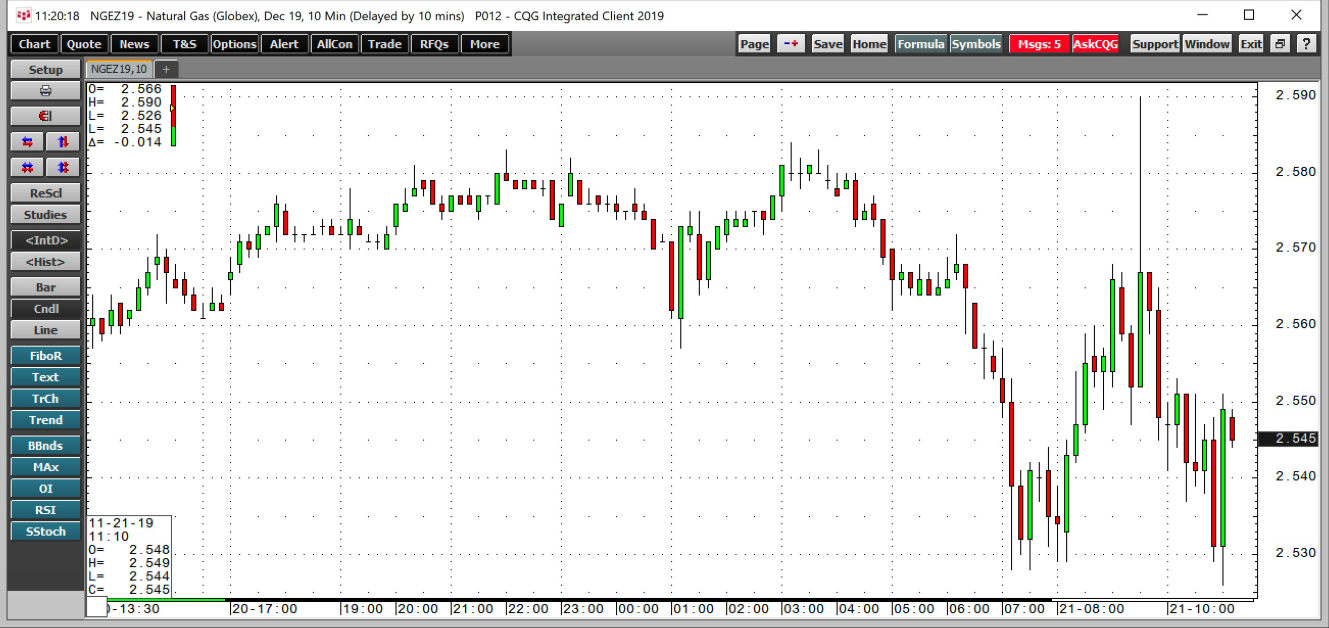
The ten-minute chart shows that the price spiked up to $2.59 in the aftermath of Thursday’s report but quickly pulled back to the $2.55 per MMBtu level. Natural gas focused on the weather forecasts for the coming week rather than the significant stock drawdown on November 22. Time will tell if the market has a delayed reaction to the upside. The market is likely waiting for colder forecasts before the price attempts to make a move on the upside once again. At the same time, the island reversal is hanging above the market like a bearish technical weight.
The Injection Season Ends With A Peak Of 3.732 tcf
The 2019 injection season ended on November 8, with a total of 3.732 trillion cubic feet of the energy commodity in storage across the United States. The amount of gas was 485 billion cubic feet or almost 15% higher than the peak in 2018. The level of inventories means that there is more cushion during the 2019/2020 winter season than last year at this time when the price rose to a high at $4.929 per MMBtu.
While the price is not likely to come anywhere near the November 2018 high this peak season, I continue to expect at least one move to challenge the $3 level on the nearby futures contract. It is too early in the season for natural gas to trade at $2.50 per MMBtu or lower, as the price will be as fickle as the weather over the rest of 2019.
The United States Natural Gas Fund L.P. (NYSE:UNG) was trading at $20.01 per share on Thursday afternoon, down $0.05 (-0.25%). Year-to-date, UNG has declined -14.19%, versus a 16.73% rise in the benchmark S&P 500 index during the same period.
UNG currently has an ETF Daily News SMART Grade of C (Neutral), and is ranked #51 of 109 ETFs in the Commodity ETFs category.
