It’s been a long time since an article about commodities felt like ‘click bait.’ After all, commodity indices have been generally declining for about seven years – although 2016 saw a small advance – and the Bloomberg Commodity Index today sits 63% below its all-time high set in the summer of 2008. I’ve written before, quite a bit, about this absurdity of the market, represented in the following chart comparing one real asset (equities) to another real asset (commodities). The commodity index here is the Bloomberg spot index, so it does not include the drag (boost) from contango (backwardation).
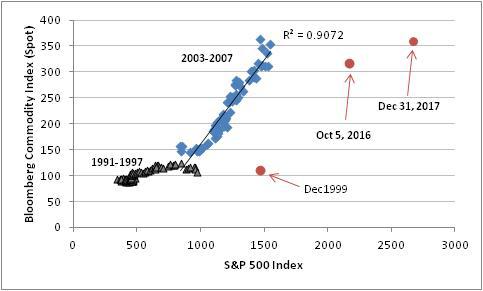
This is the fair comparison for a forward-looking analysis. Some places you will see the commodity index plotted against the S&P, as below. Such a chart makes the correct inference about the historic returns to these two markets; the prior chart makes a more poignant point about the current pricing of stocks versus commodities.
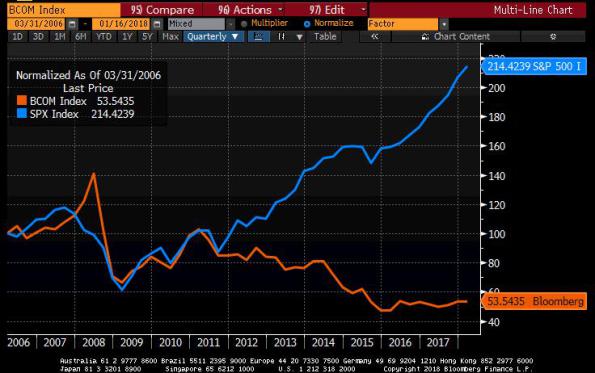
There’s nothing that says these two markets should move in lock-step as they did from 2003-2007, but they ought to at least behave similarly, one would think. So it is hard to escape the reasoning that commodities are currently very cheap to equities, as one risk-asset to another.
Furthermore, commodity indices offer inflation protection. Here are the correlations between the GSCI and headline inflation, core inflation, and the change in those measures, since 1970 and 1987 respectively.
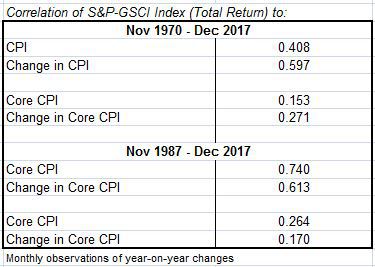
Stocks? Not so much!
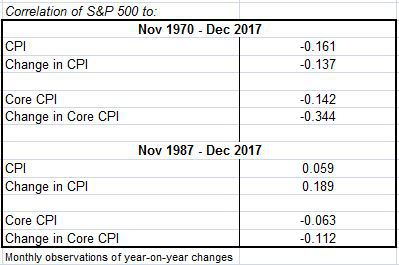
So, commodities look relatively cheap…or, anyway, they’re relatively cheaper, having gone down for 7 years while stocks went higher for 7 years. And they give inflation protection, while stocks give inflation un-protection. So what’s not to like? How about performance! The last decade has been incredibly rough for commodities index investors. However, this is abnormal. In a watershed paper in 2006 called Facts and Fantasies about Commodity Futures, Gorton and Rouwenhorst illustrated that, historically, equities and commodity futures have essentially equivalent monthly returns and risks over the period from 1959-2004.
Moreover, because the drivers of commodity index returns in the long run are not primarily spot commodity prices[1] but, rather, the returns from collateral, from roll or convenience yield, from rebalancing, and from “expectational variance” that produces positive skewness and kurtosis in commodity return distributions,[2] we can make some observations about how expected returns should behave between two points in time.
For example, over the last few years commodities markets have been heavily in contango, meaning that in general spot prices were below forward prices. The effect of this on a long commodity index strategy is that when futures positions are rolled to a new contract month, they are being rolled to higher prices. This drag is substantial. The chart below shows the Bloomberg Commodity Index spot return, compared to the return of the index as a whole, since 2008. The markets haven’t all been in contango, and not all of the time. But they have been in serious contango enough to cause the substantial drag you can see here.
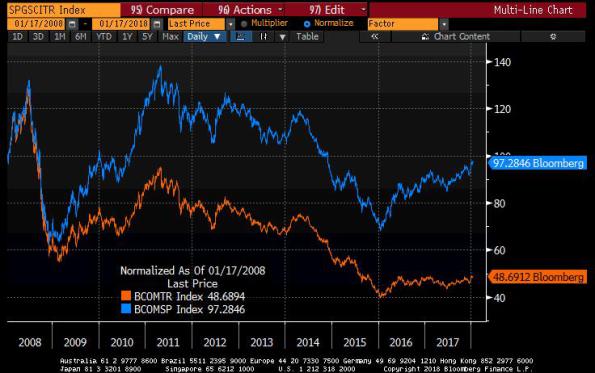
So here is the good news. Currently, futures market contango is the lowest it has been in quite a while. In the last two years, the average contango from the front contract to the 1-year-out contract has gone from 15% or so to about 2% backwardation, using GSCI weights (I know I keep switching back and forth from BCOM to GSCI. I promise there’s nothing sinister about it – it just depends what data I had to hand when I made that chart or when it was calculated automatically, such as the following chart which we compute daily).
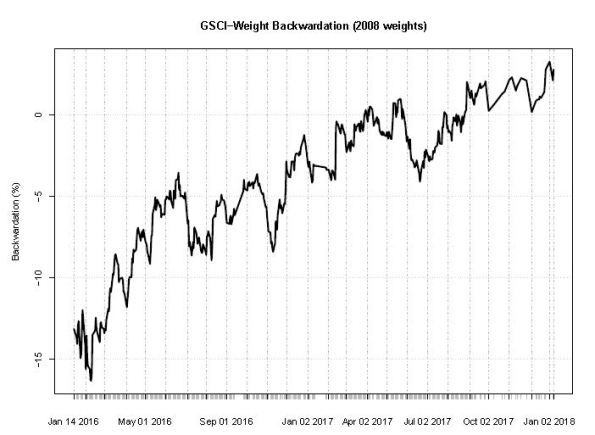
That chart implies a substantial change in the drag from roll yield – in fact, depending on your weights in various commodities the roll yield may currently be additive.
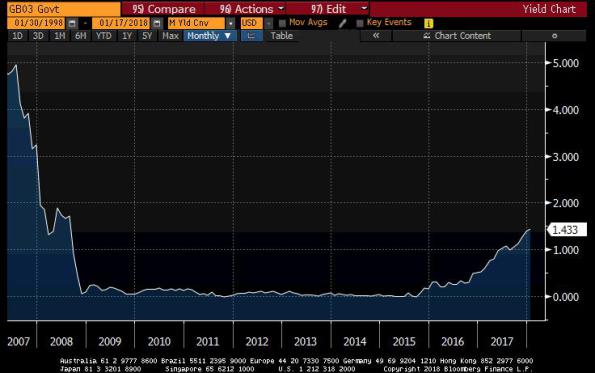
The other positive factor is the increase in short-term interest rates. Remember that a commodity index is (in most cases) represents a strategy of holding and rolling futures contracts representing the desired commodity weights. To implement that strategy, an investor must put up collateral – and so an unlevered commodity index return consists partly of the return on that particular collateral. It is generally assumed that the collateral is three-month Treasury Bills. Since the financial crisis, when interest rates went effectively to zero in the US, the collateral return has approximated zero. However, surprise! One positive effect of the Fed’s hiking of rates is to improve projected commodity index returns by 1.5-2% per year (and probably more this year). The chart below shows 3-month TBill rates.
I hope this has been helpful. For the last 5 years, investing in commodities was partly a value/mean-reversion play. This is no longer so true: the change in the shape of the futures curves, combined with rising interest rates, has added substantially to the expected return of commodity indices going forward. It’s about time!
[1] This is a really important point. When people say “commodities always go down in the long run because of increased production,” they’re talking about spot commodity prices. That may be a good reason not to own spot gold or silver, or any physical commodity. Commodity spot returns are mean reverting with a downward slant in real space, true. But a commodity index gets its volatility from spot returns, but its main sources of long term return are actually not terribly related to spot commodities prices.
[2] In other words while stocks “crash” downwards, commodities tend to “crash” upwards. But this isn’t necessary to understand what follows. I just want to be complete. The term “expectational variance” was coined by Grant Gardner.
