According to Bank of America’s research team, 87% of prior bull-to-bear transitions involved increases in volatility. That’s not particularly surprising. Anyone who has experienced a stock bear probably remembers months and months of extraordinary price swings.
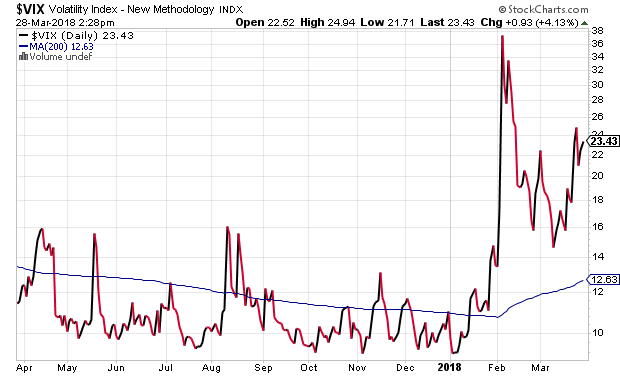
In the current bull portion of the bull-bear cycle (3/09-?), each of the previous corrections offered buying opportunities. For example, there were two 10%-plus volatile price pullbacks during the earnings recession (2015-2016). Earnings per share across the S&P 500 kept shrinking, yet buying the August 2015 dip and the January 2016 sell-off proved beneficial. Similarly, in the 2nd quarter of 2012, the S&P 500 sank into correction mode due to domestic employment concerns and fears of Euro-zone economic contraction. Nevertheless, shrugging off the global economic worries and acquiring more stock ultimately benefited risk-takers.
The 2011 sovereign debt crisis may have been more difficult with regard to “keeping the faith.” European stocks shed 40% whereas the S&P 500 managed to survive with a 19% top-to-bottom decline. Yet, those that believed Portugal, Italy, Greece and Spain (PIGS) would find a path for holding it together were richly rewarded.
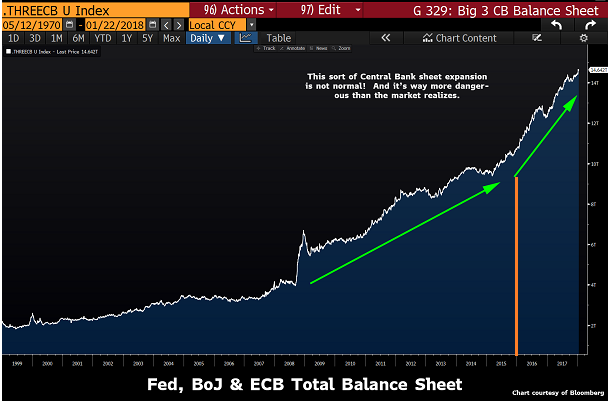
What many fail to recognize about these previous corrective phases, as opposed to 2018’s unresolved pullback, is the extent of central bank accommodation that had been enacted. In 2011, Eurozone members established the European Financial Stability Facility, providing emergency lending to troubled nations. That was not enough. The head of the European Central Bank (ECB) Mario Draghi made good on his words to do “whatever it takes” to preserve the euro-zone. It followed that the ECB bought gobs of junk-rated sovereign bonds, pushing borrowing costs into the basement so that nations could pay back the interest on their excessive debt loads.
In 2012, as the U.S. stock market was rolling over, the Federal Reserve (Fed) unleashed its most ambitious electronic money creating scheme yet: Open-ended QE3. The Fed bought hundreds upon hundreds of billions in government obligations with currency credits created out of thin air, pushing borrowing costs ever-downward to stimulate the U.S. economy.
Not to be outdone, in January of 2016, globally coordinated central bank activity aimed to prevent a global recession. The Fed pulled back from a 4-rate hike annual plan to a 1-shot in December. Meanwhile, the ECB and the Bank of Japan (BOJ) each enacted more quantitative easing (QE) than either had engaged in before. Note: Fiscal stimulus via tax reform added more stock fuel to the U.S. financial market fire in November of 2016.
The question that many are trying to answer, then, is whether or not to buy the current stock pullback. And, of course, a corollary. If the answer is, “No,” then perhaps it would be sensible to take some profits.
Granted, nobody knows with certainty what the stock market will do next. Nevertheless, one can look at objective evidence to make a well-reasoned investment decision.
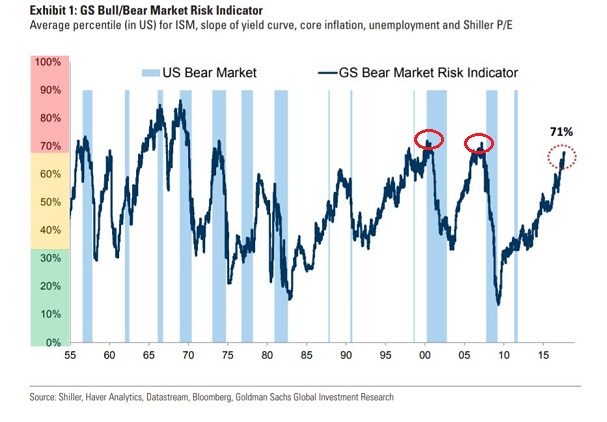
For example, Goldman Sachs puts forward a Bull/Bear Risk Indicator with data dating back to the 1950s. They look at things like economic activity, the yield curve, inflation, unemployment and the cyclically-adjusted price-to-earnings ratio. And at 71%, Goldman sees “red-light-district” risk of participation.
Yet don’t take Goldman’s word for it. The Bank of America team has highlighted similar signpost risks, including: (a) Fed raising overnight lending rates by at least 75 basis points, (b) 30%-plus returns over prior 24 months, (c) Consumer Confidence breaching the 100 level, (d) momentum stocks outperforming over the prior 9 months, and (e) CBOE VIX Volatility higher than 20 as well as rising over prior 3 months.
Okay, so Goldman and Bank of America see elevated risks. So what? Well, the economy itself is not growing as much as the hype has been calling for.
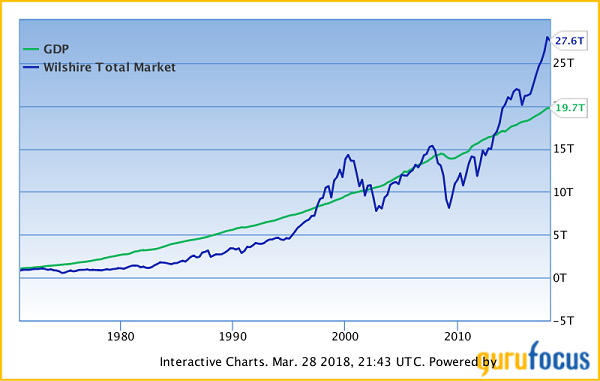
Consider the three longest bull markets in history as each relates to gross domestic product (GDP). (Note: All of them had similar trough-to-peak annualized percentage gains on the S&P 500, not far from 17%). In the 8/82-7/90 bull, real GDP was a spectacular 4.2%. In the 11/90-3/00 bull, real GDP grew at 3.5%. In the present bull portion of the bull-bear cycle? A meager 2.1%.
What are we talking about here? We’re talking about paying the same price for stock shares on HALF of the economic growth. We’re also talking about the propensity for stock prices to revert back to the economic trend. Or lower. If that turns out to be the case, 2600 on the S&P 500 would head for 1600 in the next bear.
“No, No, No,” you say. “It’s all about the interest rates.” Well, I am glad you brought that up.
The Federal Reserve’s current overnight target rate is 1.5%-1.75%. Meanwhile, core inflation is 1.5%. This implies that for the first time since the Great Recession, the real policy rate for the Federal Reserve is positive. And for one of the longest economic expansions on record, an inflation-adjusted policy rate that is positive represents a major shift from an accommodating stance to a curb-the-enthusiasm stance.
Never mind the fact that the Fed intends to hike the overnight lending rate two or three more times in 2018 alone. Far more daunting? The Fed will be accelerating the pace at which it reduces its balance sheet throughout the year.
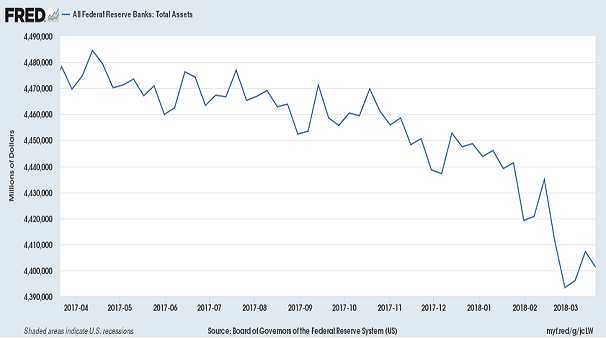
If the Fed continues to move in the direction it currently promises, then one of two outcomes becomes exceptionally likely: (1) Key borrowing costs for businesses and consumers will continue moving higher, or (2) The Treasury Bond yield curve will invert.
Behind Door #1, public corporations with record high debt loads will be rolling over obligations and “refinancing” them at higher borrowing terms. It will suppress their ability to buy back shares of their stocks and inhibit necessary capital expenditures. Tapped out consumers will also be stretched in ways that would likely harm real estate affordability and other big ticket consumer items.
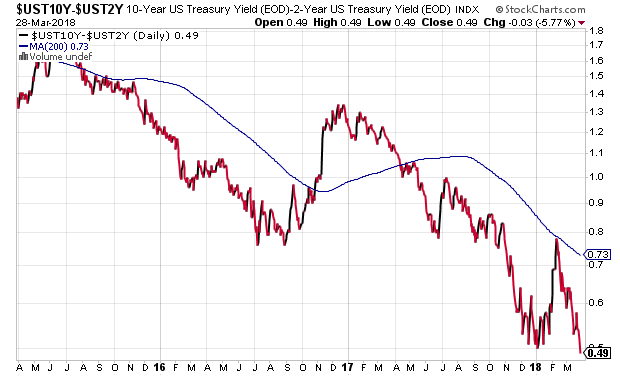
What about Door #2? The inverted yield curve? If longer-term rates were lower than shorter-term rates, financial markets themselves would be forecasting recession. And the Fed would have itself to blame, not to mention its credibility damaged. Ironically enough, we are closing in on the possibility that two or three rate hikes might conceivably invert the yield curve. Note: Only 49 basis points separate the 10s and the 2s.
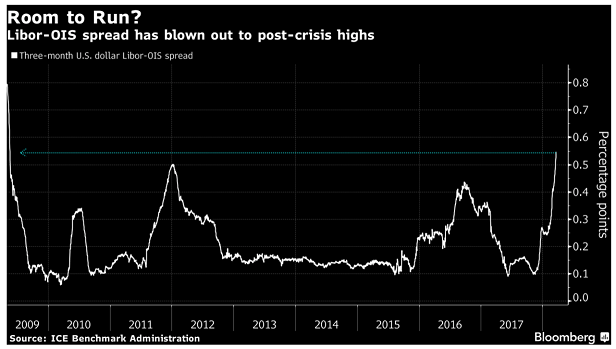
If you still believe that the rate environment is favorable going forward, perhaps you were not aware that $350 trillion in financial vehicles are linked to the London Inter-bank Offered Rate (a.k.a. “LIBOR”). Floating-rate obligations (e.g., adjustable mortgages, etc.) reprice to LIBOR plus a spread. And as of right this moment, the cost of capital tied to LIBOR has been rising like a rocket ship.
Long story short, when central bank policy tailwinds existed, stocks could climb the cliched “Wall of Worry.” North Korea? No problem. Terrible corporate earnings? No big deal.
With central bank policy headwinds, however, blemishes suddenly become festering boils. China trade war? Huge problem. Musical chairs in the White House? Very big deal. Indeed, six of the ten major sectors are already below respective long-term trendlines (i.e., Materials, Energy, Consumer Staples, Real Estate, Telecom and Utilities).
Disclosure Statement: ETF Expert is a web log (“blog”) that makes the world of ETFs easier to understand. Gary Gordon, MS, CFP is the president of Pacific Park Financial, Inc., a Registered Investment Adviser with the SEC. Gary Gordon, Pacific Park Financial, Inc., and/or its clients may hold positions in the ETFs, mutual funds, and/or any investment asset mentioned above. The commentary does not constitute individualized investment advice. The opinions offered herein are not personalized recommendations to buy, sell or hold securities. At times, issuers of exchange-traded products compensate Pacific Park Financial, Inc. or its subsidiaries for advertising at the ETF Expert website. ETF Expert content is created independently of any advertising relationship.
