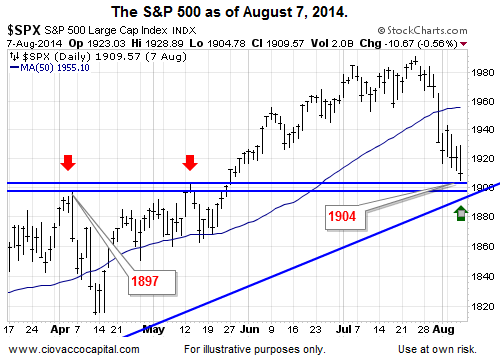
A week ago today the S&P 500 dropped 10 points bringing the weekly bearish tab to 15 points. Seven days ago, the only real positive was the potential support we noted on August 7 (see chart below).

Putin Eases Some Of The Tension
Since August 7, the S&P held support and has rallied 45 points. What happened? While there are countless inputs influencing the decisions of billions of consumers/investors around the globe, one factor has been decreasing fear relative to the Russia/Ukraine conflict. More stress relieving news came Thursday. From Reuters:
Putin told Russian ministers and members of parliament in Crimea that Russia would stand up for itself but not at the cost of confrontation with the outside world, easing off months of tough rhetoric over Ukraine.
Possible Resistance For Stocks
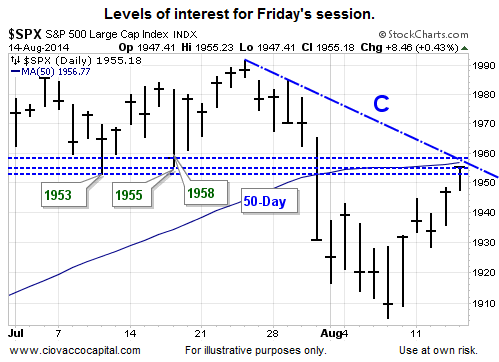
The busy-looking chart below shows several areas of possible S&P 500 resistance between 1953 and 1958. A close Friday above 1958 would increase the odds of an ongoing rally in equities. It is not possible for stocks to push significantly higher without first closing above trendline C. Therefore, as long as the S&P 500 remains below 1958, we will exercise some short-term caution relative to our cash.

Easy Central Bankers
On August 13, we outlined the “good news is bad news” theory. More supporting evidence for the Federal Reserve to keep rates low longer came in the form of a weaker than expected labor report Thursday. From Bloomberg:
Applications (INJCJC) for unemployment benefits in the U.S. rose more than forecast last week, interrupting a steady decline to pre-recession lows. Jobless claims climbed by 21,000 to 311,000 in the period ended Aug. 9, the highest in six weeks, a Labor Department report showed today in Washington. The median forecast of 48 economists surveyed by Bloomberg called for 295,000.
Financial markets love low rates. The European Central Bank (ECB) has data in hand to consider not only a continuation, but expansion of their easy-money policies. From The Wall Street Journal:
The euro-zone economy stalled in the second quarter, raising the ugly prospect that the region’s recent weak recovery after its long debt crisis has already lost momentum as it faces fresh headwinds from Russia and Ukraine. Germany’s economy shrank for the first time in more than a year, a development economists largely attributed to a mild winter that boosted activity in the first quarter at the expense of the second. The bigger concerns, they say, are France and Italy, where respectable rates of growth aren’t even in sight.
Investment Implications – The Weight Of The Evidence
The tweet below from Thursday’s trading session sums up the current state of affairs:

Therefore, our model is still calling for some S&P 500 exposure (ARCA:SPY). We also have some folding money complimented by bonds (ARCA:TLT). If the S&P 500 can close over 1958, our model will most likely call for an incremental shift from cash to growth-oriented assets. While we have not made any calls yet, our short list includes technology (NYSE:IYW), healthcare (ARCA:XLV), real estate (ARCA:IYR), materials (ARCA:XLB), Asia (NASDAQ:AAXJ) and U.S. growth stocks (ARCA:VUG). We will enter Friday’s session with a flexible, unbiased and open mind.
