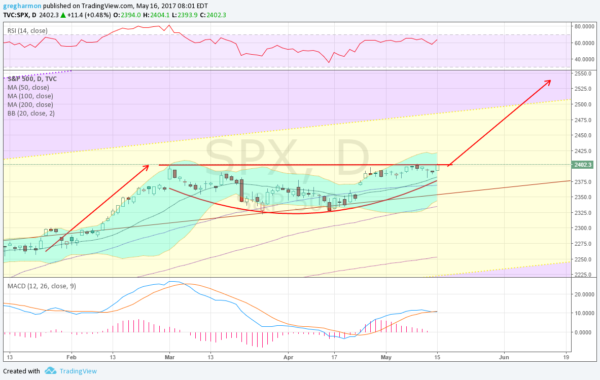
The S&P 500 shot higher after the November election. Within 2 weeks it had made a new all-time high and kept going. Some consolidation began in December and then as the calendar was turning to February it started higher again. New all-time highs all along the way. It touched 2400 March 1st and that seemed to be the end. A pullback started that took the Index back to a low at about 2330 towards the end of March. Crowds were calling for more downside. Failed healthcare plans, no wall, slowing earnings growth, bad GDP, you name it there excuses were around every corner.
But none of them ever managed to sink the S&P 500. It moved slightly higher then fell back and retested the March low. And held. The move up from there that started in April broke above the April 5 peak, confirming a double bottom on the pullback. It kept going until it reached that March 1 high again and has stalled. Will it fall back again? The chart below suggests not. In fact it points to the possibility of a move much higher.

The move into the rounding base, or saucer, points to a target out of it to the upside of 2550. If that were to happen at the same pace as the last leg up it would coincide with the June FOMC meeting. Momentum is on its side to get there. The RSI is holding strong in the bullish zone while the MACD is avoiding a cross down and turning back up. The Bollinger Bands® are also turned to the upside.
Maybe more importantly for these 3 indicators is that they are no where near being hot, or overbought, as the S&P 500 starts a break out of consolidation to the upside. There is room to run. Anything can happen in a market driven by sentiment, fundamentals and just crazy motives. But it seems from following the price action the S&P 500 wants to go to the moon.
The information in this blog post represents my own opinions and does not contain a recommendation for any particular security or investment. I or my affiliates may hold positions or other interests in securities mentioned in the Blog, please see my Disclaimer page for my full disclaimer.
