For the first time since 2010, the average price of a gallon of gas in the United States has fallen below $3, according to AAA’s Daily Fuel Gauge Report. An estimated $40 billion will be saved this year alone. That’s money that can be put toward other expenses—bigger cars, children’s education, retirement and investing.
But that discount comes with a price. Cheap gas might help consumers and companies in certain industries, but they’re a drag on oil producers, retailers and entire nations. This affects everyone. We live in a global economy, after all.
Since June, crude oil has tumbled 30 percent to prices we haven’t seen in about three years. For the past 20 days and 60 days, it’s down about two standard deviations. We can blame this dip on a number of things: geopolitics, the slowing of real GDP growth across the globe, a huge oil surplus here in the U.S. and a strong dollar. The strength of the dollar, as you can see, has historically had an inverse relationship with the price of oil. 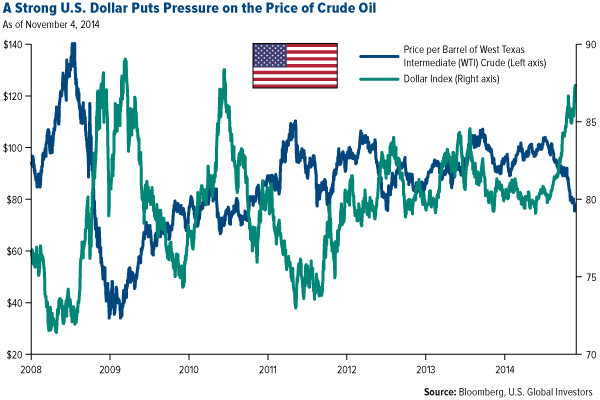
Recent cuts to our military budget have also affected oil prices. The U.S. military uses more oil than any other institution on earth. Every year it consumes over 100 million barrels to fuel ships, aircraft and other vehicles, but that number is dropping at the same time supply is rising.
Meet the Frackers
Because of the success of unconventional extraction methods such as fracking, the U.S.’s production level is at a 25-year high. What would the rate of depletion be if fracking were no longer profitable at $70 or $60 per barrel and production had to be halted? There’s no definitive answer to that question because it’s not clear how many companies would be affected and to what extent. But what should be clear is that reserves would begin to shrink and we would go back to the days of an overreliance on foreign oil.
Below are the estimated breakeven points for some of the most important shale plays in the U.S. With crude currently priced at slightly under $80 per barrel, many companies, especially those that practice fracking, are starting to feel the pinch. Each play has its own unique set of challenges, one of the most significant being the region’s geology. As you can imagine, the harder it is to get the crude out of the ground, the costlier it becomes. 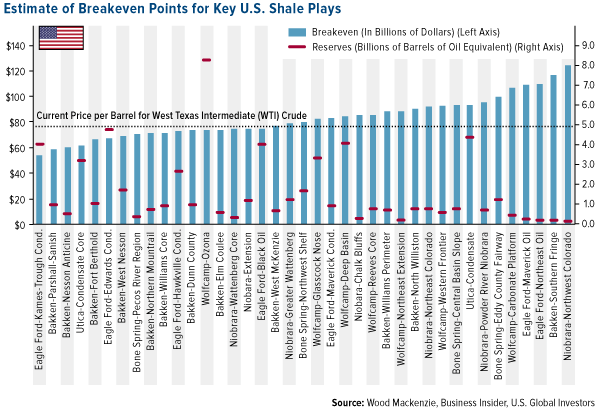
Some analysts believe that approximately a third of all U.S. shale oil producers operate in the red when the price per barrel falls below $80. At $70 a barrel, these producers will need to make drastic changes such as production cuts and layoffs. According to energy research firm Wood Mackenzie: If WTI prices were below $70 for most of 2015, we predict that around 0.6 million b/d [barrels per day] of U.S. tight oil supply growth would be under serious threat by the end of the year—a figure which would continue to increase with low prices.
And if crude were to fall to $60 per barrel? An estimated 80 percent of U.S. companies that extract tight oil, or shale oil, through fracking would be shut down and all new supply would diminish quickly due to the rapid decline rate.
Already, oil producers must contend with the challenge of decreased production. When a well is first drilled, it might begin producing 1,200 barrels a day but, throughout the year, gradually decline between 5 and 20 percent. By the end of the year, the site is producing only around 100 barrels a day. Oil producers are often able to recoup exploration and production costs in that time frame, but then it’s necessary to move on to the next drill site. 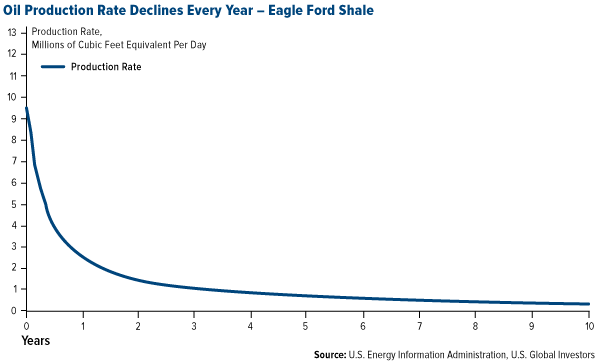
Unconventional extraction methods accelerate the decline rate. If frackers were forced to halt production now, our reserves would dwindle even more rapidly.
It’s critical that America keeps running on this treadmill, so to speak. The results of stopping now would be similar to those of a workout buff who suddenly quits going to the gym. We all know how much harder it is to get back in shape than it is to stay in shape.
Layoffs would especially hurt, given that the tight oil revolution has significantly contributed to the U.S.’s economic recovery. Think not just of general oilfield roustabouts but also geoscientists, petroleum engineers and the thousands of other incidental professionals who face losing their jobs if prices continue to slip. Meanwhile, people continue to have babies, drive their vehicles to work and heat their homes, all of which requires oil.
And there’s reason to believe that we’ll especially need oil for heating this winter. Already an intense storm even larger than Superstorm Sandy, Typhoon Nuri, is moving west along Alaska’s Aleutian Islands and is expected to bring freezing temperatures to much of the northern part of the U.S. It looks as if winter has arrived earlier than normal this year. 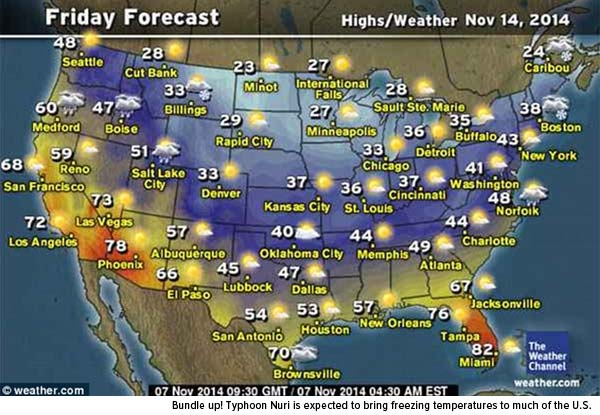
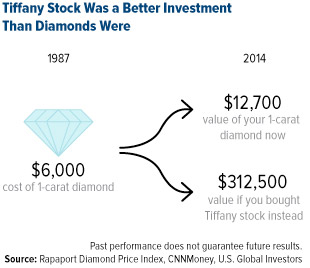
For the time being, however, we can all enjoy lower gas prices this year. With the money saved, we can make better investment decisions. It’s as if we received an unexpected tax break. Lower gas prices leads to more consumer spending, which means that luxury goods stocks such as Tiffany & Co. might benefit.
Speaking of Tiffany & Co., did you know that buying the company’s stock in 1987, the year it went public, would have been a better investment than buying an actual diamond? You can read about it here.
Enter the Saudis: Who Will Blink First?
Many of the world’s major oil-producing countries are also feeling the pressure of low prices. Of those shown below, only four—Oman, Kuwait, Qatar and the United Arab Emirates—are still able to balance their books with Brent oil flirting with $80 a barrel. 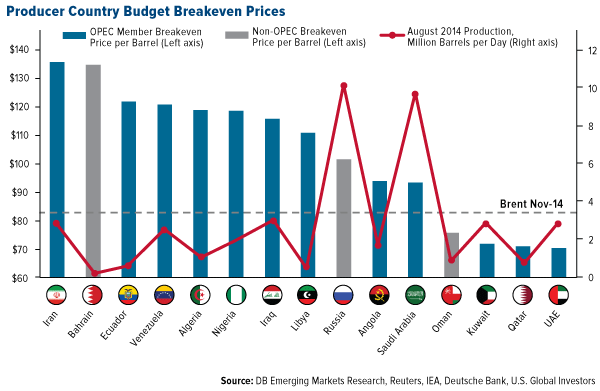
Here’s where geopolitics comes into play. Russia is currently the second-largest oil exporter in the world and set to overtake Saudi Arabia very soon. This might help explain why the Saudis aren’t in any hurry to limit their own production and support prices. They have everything to lose and nothing to gain by reducing output.
They’re in a better position to maintain current levels and still be profitable with $80 oil than Russia, the U.S. and most of the Organization of the Petroleum Exporting Countries (OPEC). The kingdom has already lowered the price of the oil it exports to the U.S., a sign that it’s aiming to undercut the competition and hang on to its status as the world’s top exporter.
As oil and gas policy expert Dr. Kent Moors argues in a recent article, Saudi Arabia is fighting a losing battle against three fronts: Russia, over control of the Asian market; neighboring OPEC members such as Iraq and Iran; and the U.S., a market the Saudis don’t want to lose to more efficient fracking companies here in America. And, of course, the U.S. and Russia are locked in their own energy skirmish, one that Casey Research’s Marin Katusa calls The Colder War, the title to his latest book.
OPEC officials will be meeting later this month, and hopefully an agreement can be reached. During our webcast last month, Brian Hicks, portfolio manager of our Global Resources Fund (PSPFX), emphasized the point that the current price of oil just isn’t sustainable: I would be surprised if we did not see another production cut if oil remains at these levels. I think that OPEC and the Saudis need to come in and support prices even more so than they already have following the cut in August.
One Word: Plastics
Just as consumers have benefited from sliding oil prices, so too have many companies, including those in the transportation sector. Below you can see that near the start of September, the oil and gas industry decoupled from the transportation sector, composed of airline, trucking, delivery services, railroad and marine transportation companies. Currently there’s more than a 35-point spread between the Dow Jones Transportation Average and SPDR S&P Oil & Gas Exploration and Production ETF (NYSE:XOP). 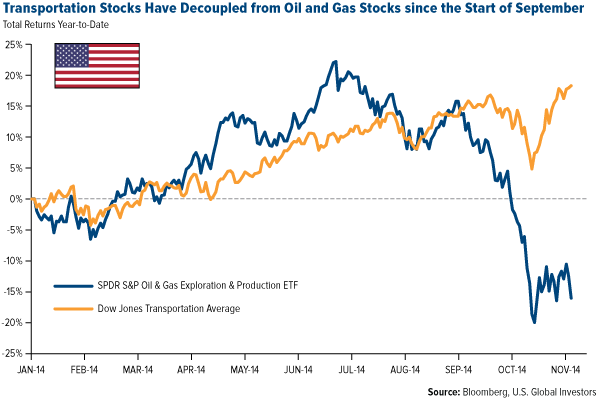
Manufacturers of plastics and synthetic rubber, of which crude is the main component, have also benefited. The U.S. producer price of plastics and rubber products is up $1.20 year-to-date. In 30 days, Cooper Tire & Rubber (NYSE:CTB) has shot up 13 percent, Berry Plastics (NYSE:BERY) 14 percent, Goodyear Tire & Rubber (NASDAQ:GT) 15 percent.
Royal Dutch Shell A (NYSE:RDSa), on the other hand, has given back 5 percent.
This is precisely why we’re attracted to low-cost oil producers such as EOG Resources Inc (NYSE:EOG) and Devon Energy Corporation (NYSE:DVN). Many, but not all, of them are nimbler and more adaptable in uncertain economic climates than the big names are. We strive to buy only those that have been well screened and fit our models.
Late last month I noted that the the eurozone is in trouble because its monetary and fiscal policies are sorely out of balance. The region relies too much on punitive taxes and entitlement spending and not enough on stimulation. Right now its GDP growth rate is a sluggish 0.1 percent, its inflation rate 0.4 percent.
I suggested that the eurozone should look to China to see how it’s handling its own slowdown—the government has cut hundreds of lines of regulation and plans to cut more—but members of the European Union, and especially the European Central Bank (ECB), might also do well to look to China’s neighbor, Japan.
A week ago the Bank of Japan (BOJ) surprisingly unveiled a gargantuan $724 billion-a-year stimulus package to combat deflation. The monetary measure will essentially turn the BOJ’s governor, Haruhiko Kuroda, into the world’s largest hedge fund manager. The market seemed to like the announcement, as the Nikkei 225 has risen 3 percent since then. 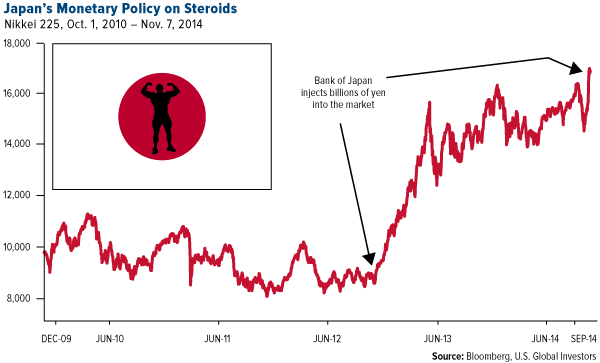
Such a plan, of course, is too extreme for the ECB to make, and there’s no guarantee that it will work. But at least no one can fault Japan for refusing to use both tools, monetary and fiscal policy, to jumpstart its economy and effect change.
Disclosure: Please consider carefully a fund’s investment objectives, risks, charges and expenses. For this and other important information, obtain a fund prospectus by visiting www.usfunds.com or by calling 1-800-US-FUNDS (1-800-873-8637). Read it carefully before investing. Distributed by U.S. Global Brokerage, Inc.
Past performance does not guarantee future results.
Foreign and emerging market investing involves special risks such as currency fluctuation and less public disclosure, as well as economic and political risk. Because the Global Resources Fund concentrates its investments in specific industries, the fund may be subject to greater risks and fluctuations than a portfolio representing a broader range of industries.
Gold, precious metals, and precious minerals funds may be susceptible to adverse economic, political or regulatory developments due to concentrating in a single theme. The prices of gold, precious metals, and precious minerals are subject to substantial price fluctuations over short periods of time and may be affected by unpredicted international monetary and political policies. We suggest investing no more than 5% to 10% of your portfolio in these sectors.
The Dow Jones Transportation Average is a price-weighted average of 20 U.S. transportation stocks.
Fund portfolios are actively managed, and holdings may change daily. Holdings are reported as of the most recent quarter-end. Holdings in the funds mentioned as a percentage of net assets as of 9/30/2014: Berry Plastics 0.00%, Cooper Tire & Rubber Company 0.00%, Devon Energy Corp. 1.82% in Global Resources Fund, EOG Resources, Inc. 2.13% in Global Resources Fund, Goodyear Tire and Rubber Company 0.00%, Royal Dutch Shell 0.00%, SPDR S&P Oil & Gas Exploration & Production ETF 0.00%, Tiffany & Co. 0.44% in Gold and Precious Metals Fund.
Standard deviation is a measure of the dispersion of a set of data from its mean. The more spread apart the data, the higher the deviation. Standard deviation is also known as historical volatility.
All opinions expressed and data provided are subject to change without notice. Some of these opinions may not be appropriate to every investor. By clicking the link(s) above, you will be directed to a third-party website(s). U.S. Global Investors does not endorse all information supplied by this/these website(s) and is not responsible for its/their content.
