Clients are being told that the shock of this global pandemic (for the S&P 500 and the U.S. anyway) was analogous to a car traveling down a highway at 60 miles per hour, and then suddenly having the automatic transmission thrown into park.
Yesterday’s highest print for jobless claims in the last 50 years (and probably the post WW II period, although I don't know when the data series started) is evidence that the U.S. economy is in the middle of a major economic and employment shock.
It is fascinating watching the various Street firms forecasting Q2 GDP: JP Morgan just dropped their forecast from a -14% decline to -20%, while Goldman is at -20%, and a host of others are rapidly getting close to -20%. (CNBC had a great graphic showing all the sell-side GDP forecasts in one bar chart, which I unfortunately couldn’t locate on Twitter or the CNBC website.) Bank of America is at -12% (last I heard) and undoubtedly that will likely get worse with the jobless claims number.
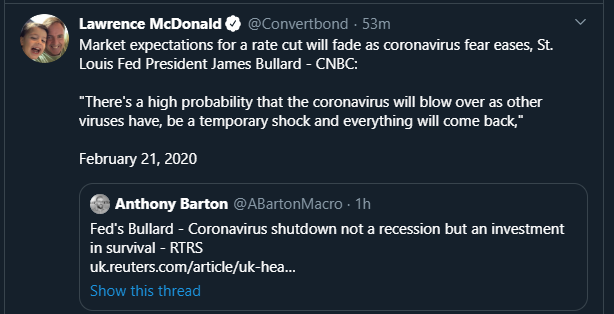
St. Louis Fed President Bullard, in his comment this past weekend saying that Q2 ’20 GDP could contract 50% was – in my opinion – majorly irresponsible. Truly I have no idea how a comment like that could benefit the public or investors, particularly after Bullard downplayed the virus threat in February ’20.

Not helpful.
This current stock market rally that now includes the first two positives days of SP 500 return since early February ’20 could be a rally into quarter end, which is helped by passive and active rebalancing demands,
- ) A re-test of the recent lows for the SP 500 around 2,237, 2,280 and 2,346 will probably occur at some point in the next 4 – 6 weeks if a real, investable bottom is to be had.

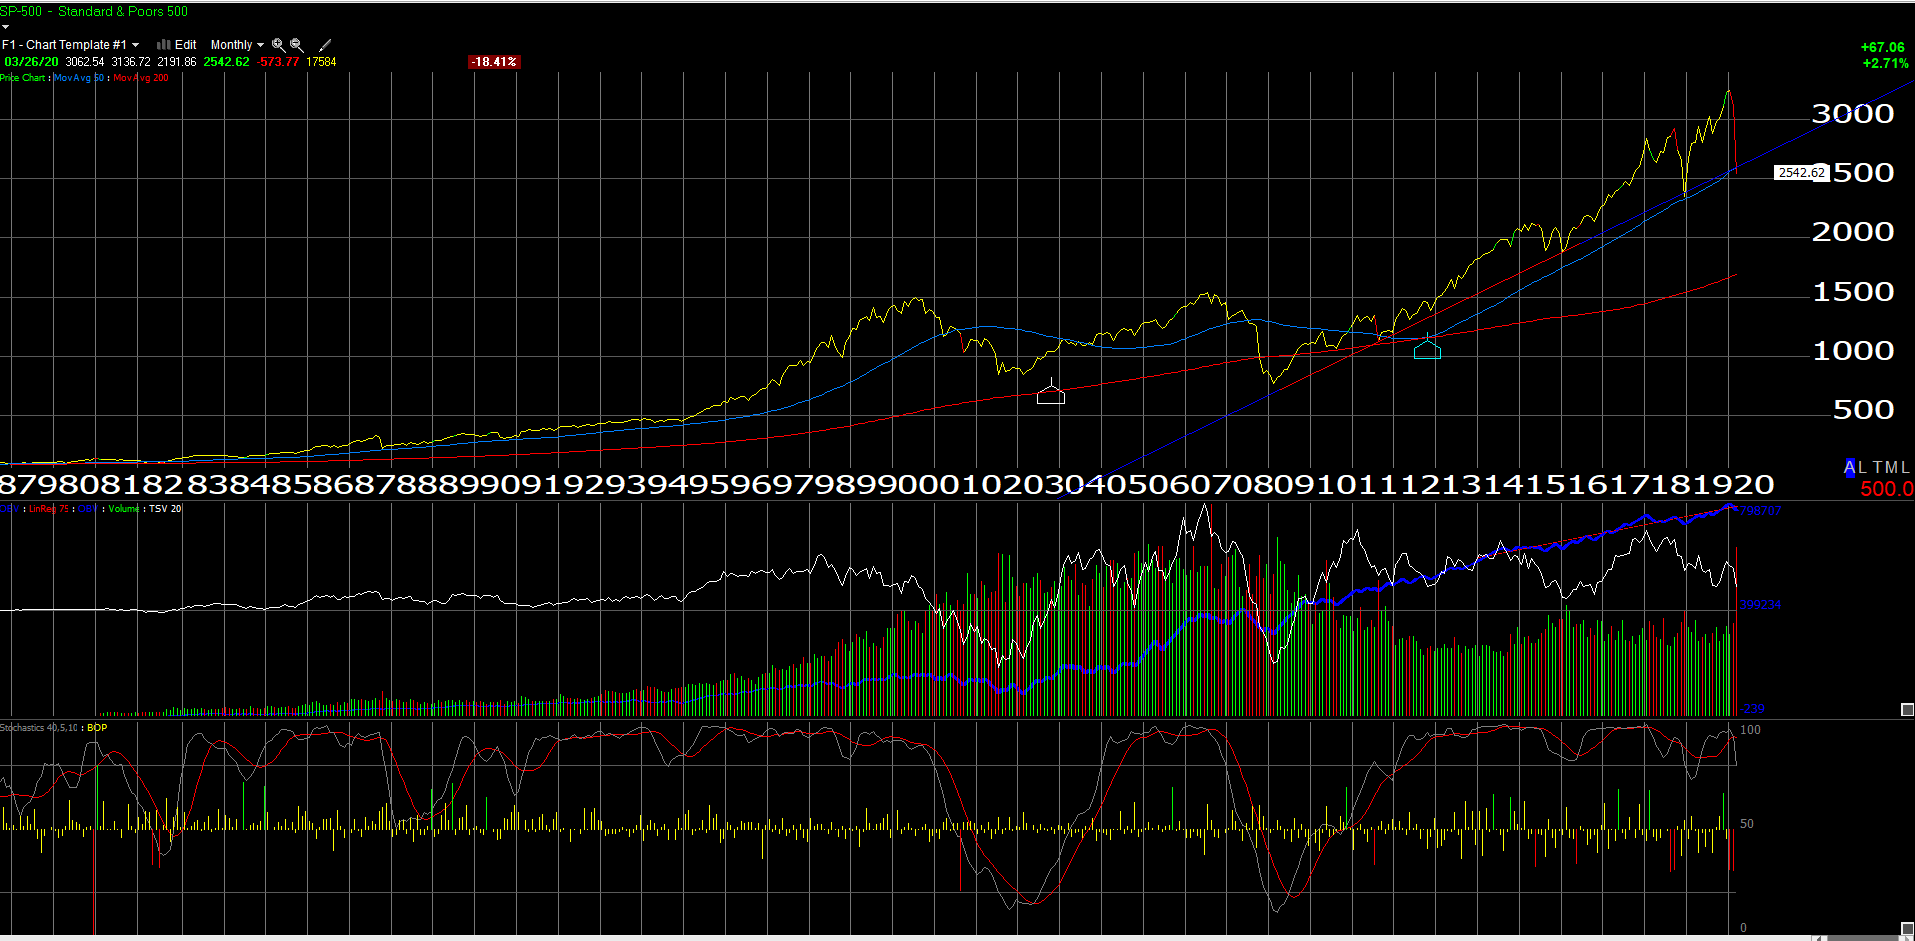
Gary Morrow (@GarySMorrow) an excellent technician followed for years, noted the importance of the December, 2018 lows for the SP 500 and it appears for now that these lows have held.
The trendline off the March, 2009 lows also appears to have held given this monthly chart of the SP 500 (Source: Worden Charts).
2.) The corporate bond market must cooperate and it has started to unlock already somewhat as the last 5-day issuance of $125 billion is close to a 1-month average issuance volume, per one observer.
3.) I think “the market” will need to have some idea what Q1 ’20 SP 500 earnings will look like, and more importantly the “linearity” of how managements saw January, February and March ’20 business progress. All the corporate earnings reports of late like an Oracle (NYSE:ORCL), FedEx (NYSE:FDX), Nike (NYSE:NKE) and Micron (NASDAQ:MU) were all February ’20 quarter end, although guidance for all but FedEx seemed more positive than you would otherwise think.
Here is an interesting note out of DataTrek blog published March 24th, 2020. DataTrek was started by Nick Colas and Jessica Rabe in the last year and I find the blog interesting reading on a nightly basis:
IN TODAY’S EDITION
Markets: March 2020 continues to run the 2008 Playbook. Today’s relief rally fits that narrative to within 1 trading day. Expect to see further outsized volatility over the next week but, if the Playbook holds, we may just tread water over that time. After that, the 2008 experience says we go lower and bottom on/before April 30th. We’ve got some thoughts about how we can avoid that fate below, but that’s where we stand today.
Data: Equity asset class performance review today. Even with today’s rip, the S&P is still down 24% YTD, the Russell is 34% lower on the year, and EAFE/Emerging Market equity returns sit in between those 2 bookends. ESG equity investing has neither insulated asset owners from the downdraft nor unduly hurt returns. Lastly, “value” and “dividend” styles have seriously underperformed “growth” and “momentum”, both YTD and since the 2/19 equity market top.
Disruption: Legalizing recreational cannabis would go a long way to plugging US state-level budget shortfalls created by the COVID-19 Crisis. For example, New York State’s Comptroller expects a shortfall of between $4 to $7 billion due to the coronavirus. Back in 2018, NYC’s Comptroller estimated that the legal, adult-use marijuana market could conservatively yield annual tax revenues of up to $1.3 billion at the state and city levels. Even at just $1 billion, that means legalizing sales of recreational cannabis could cover up to a quarter of NY’s revenue shortfall from COVID-19.
Plus our usual roundup of market action, curated links, and mind candy.
Summary / conclusion: Since rarely is much “market timing” done for clients, and thus it’s somewhat of a moot point for client portfolios, however clients are given some idea within a reasonable time frame as to what they might expect when something like this happens. My own educated guess is that – after this face-ripping rally we are seeing in the last 3 days, and probably when earnings start in the next two weeks (and probably a lot of negative pre-announcements after the first of April ) – the SP 500 will likely start to drift down towards the December ’18 lows near 2.280 and the lower lows near there that have occurred near that price level in the last two weeks, and then we might have a low for this crisis.
However, if all this happens by late April, early May ’20 the “bear market” would have happened in a relatively short period of time.
Readers may vigorously disagree, but I’ve always thought the assumption that a 20% correction should represent a “bear market” for clients was completely arbitrary . In fact i think it’s utterly ridiculous. What matters are “secular bear markets” like the March, 2000 peak at 1,550 and then not seeing that level succeeded or surpassed again until late April, early May, 2013 when the SP 500 traded firmly above the March, 2000, October 2007 peaks and then never looked back. If you’re a reader, don’t panic. I send an email to clients every morning – find an advisor that communicates with you frequently, and keeps you apprised of the what is happening within a market when “exogenous shocks” like a global pandemic occur. The mainstream financial media is littered with village idiots making “predictions”. No one can predict or know the future with any reasonable degree of probability and that is true under most what would be considered normal circumstances, let alone under a global pandemic that people are experiencing for the first time.
In February ’20, the US economic went from a “net new jobs created” of +300,000 and a 3.6% unemployment rate (lowest since Vietnam or the late 1960’s) to what will now be the sharpest contraction in GDP growth since the Great Depression (or even worse).
The worst GDP reading in the 2008 Financial Crisis was a -8.4% GDP print. The US economy could be looking at a contraction 3x that quarter in 2008.
The next 30 days economic data is going to be nothing short of horrid, and the virus data that will be reported could alternatively be both alarming and soothing as the public health departments get their arms around their own learning curve, and the progression of the virus, as well as the start of seeing a light at the end of the proverbial tunnel as many that contract the virus start to resume normal living.
Events are happening quickly. Stay invested, watch your asset allocation, try and find objective and measured sources of news and market information and look for a retest of the recent market lows – possibly – in the next 4 – 6 weeks.
Q1 ’20 SP 500 earnings starting in two weeks and Q2 ’20 guidance that accompanies those earnings will likely be HORRID by any historical measure, but therein lies opportunity.
Use the December ’18 lows and the recent lows of the last 10 days for the SP 500 as stop limit locations if you would be more comfortable raising cash. The SP 500 drawdown in 2008 was 55% in depth. I would be surprised if this drawdown got that bad given the strength of the US economy heading into this shock, but have your limits ready just in case.)
Thanks for reading.
