The U.S. stock market has been leading the rest of the world’s stock markets. Turns out that’s a good thing. As least for U.S. stocks. To illustrate this let’s look at the results achieved from holding the S&P 500 index only when U.S. stocks are “leading”.
The Test
The indexes used are:
*S&P 500 index – measures U.S. stock performance
– measures the rest of the world
The Calculations
Using monthly total return data from the PEP Database from Callan Associates from 12/31/1971 through 8/31/2018:
A1 and A2;
A1 = The cumulative total return for the S&P 500 over the latest 10 years;
A2 = The cumulative total return for the MSCI over the latest 10 years
B = The difference between A1 and A2 (i.e., SPX total 10-year return minus MSCI total 10-year return)
C = a 36-month exponential moving average of B*
D = Subtracts C from B (i.e., if B above the 36-month EMA or below it)
*If the S&P 500 Index performed better over the previous 10 years then D is positive
*If the MSCI World ex US Index performed better of the previous 10 years then D is negative.
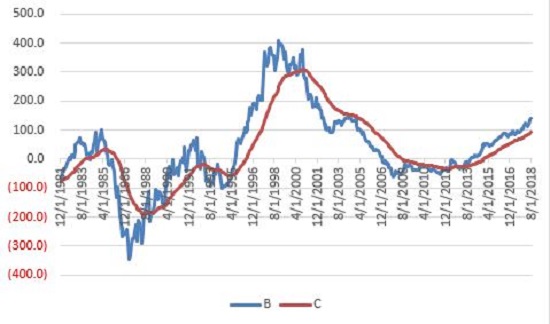
Figure 1 displays Variable B and C above.

Figure 1 – B (blue line) = difference between SPX 10-year total return and MSCI 10-year total return; C (red line) = 36-month EMA; 12/31/1981-8/31/2018
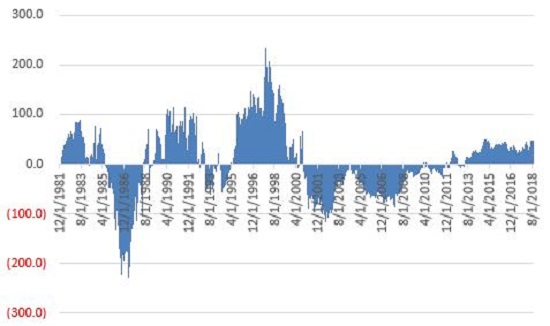
Figure 2 displays the month-end difference between Variables B and C (i.e. Variable D). When the value is positive SPX is “leading”; when the value is negative MSCI is “leading”.

Figure 2 – the month-end difference between Variables B and C (i.e. Variable D); 12/31/1981- 8/31/2018
The Test
For the purposes of this test our only concern is the performance of the S&P 500 Index when Variable D is positive.
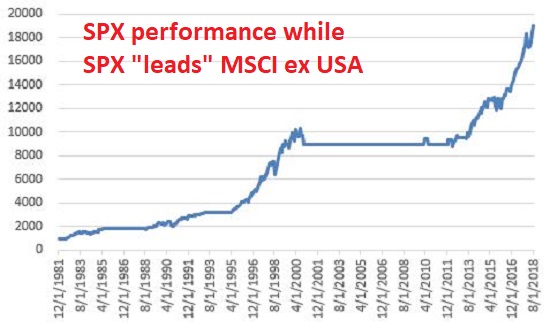
Figure 3 displays the growth of $1,000 invested in the S&P 500 Index ONLY when Variable D is positive at the end of the previous month.

Figure 3 – Growth of $1,000 invested in SPX ONLY when Variable D is positive; 12/31/1981-8/31/2018
As you can see in Figure 3, holding the S&P 500 Index when it is “leading” the MSCI World ex US Index has generated some consistently positive results.
At the moment, Variable D remains firmly in positive territory. Does this mean that the U.S. stock market is impervious to decline? Not at all. Still, the long-term results displayed in Figure 3 represent a fairly compelling piece of evidence for the bullish case.
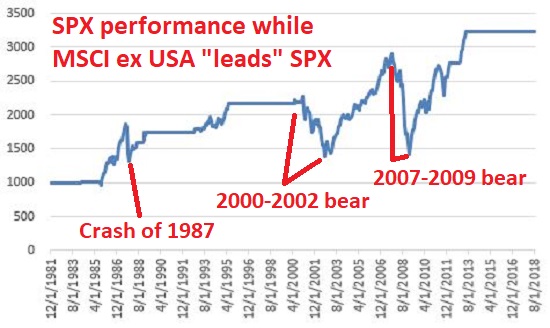
Lastly, so how did SPX perform when MSCI was leading? Interestingly, it made money. For reference:
*When SPX leads MSCI (when Variable D is positive): SPX gained +1,799%
*When SPX leads MSCI (when Variable D is negative): SPX gained +222%
In sum
*The SPX did make money (+222%) during those times when MSCI was leading
*However, SPX made 8.1 times as much when SPX was leading than when MSCI was leading
*Also, while MSCI was leading, SPX endured, a) the Crash of 1987, b) the 2000-2002 bear market, and, c) the 2007-2009 bear market (see Figure 4), i.e., all good things to avoid.

Figure 4 – Growth of $1,000 invested in SPX ONLY when Variable D is negative; 12/31/1981-8/31/2018
To put it as succinctly as possible: U-S-A, U-S-A!
