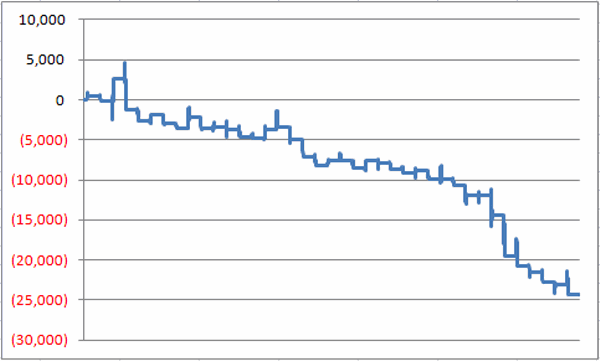
Figure 1 displays the cumulative gain/loss for holding a long position in sugar futures between the end of March Trading Day #9 and the end of April Trading Day #10 starting in 1978.
Figure 1 – Cumulative $ +(-) for Sugar futures between the end of March Trading Day #9 and the end of April Trading Day #10 (1978-2016).
(See also Speculating In T-Bonds)
For The Record
- # time UP = 13 (33% of the time)
- # times DOWN= 26 (67% of the time)
- Average $ gain during UP periods = +$681
- Average $ loss during UP periods = (-$1,283)
Summary
So is sugar destined to decline between March 13 and April 14 this year? Not necessarily. In fact this “seasonally unfavorable” period has seen sugar futures decline during each of the last 7 years. So maybe it is time for a rally this time around.
But the real point is that anyone looking to speculate on the long side of a commodities market might want to look for an opportunity with slightly higher odds of success.

