Investing.com’s stocks of the week
Several potentially negative influences may weigh on bonds in the near-term. And then again they may not. Hence the reason the title of this piece is “Speculating in Bonds” and NOT “SELL BONDS NOW!”
What we are talking about is a speculative trade that might make a few bucks if bonds do decline but won’t break the bank if bonds rally instead.
Two more important notes:
1) I am not “predicting” that bonds are about to decline. I will simply be highlighting several factors that suggest they might
2) I am not “recommending” the example trade that follows below. It is presented simply as an “example” of one low dollar risk way to bet on lower bond prices
Potential Negative Influences
#1. Seasonality
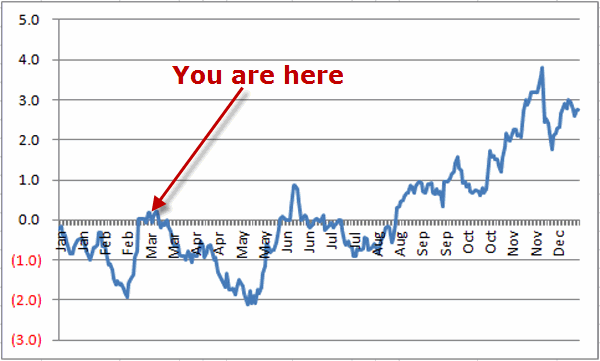
Figure 1 displays the annual seasonal pattern for t-bond futures. As you can see we are at the start of a period which typically (though not always) experiences weakness.
Figure 1
Just remember that the chart in Figure 1 displays “tendencies” and not a roadmap that bonds follow year in and year out/
#2. Elliott Wave
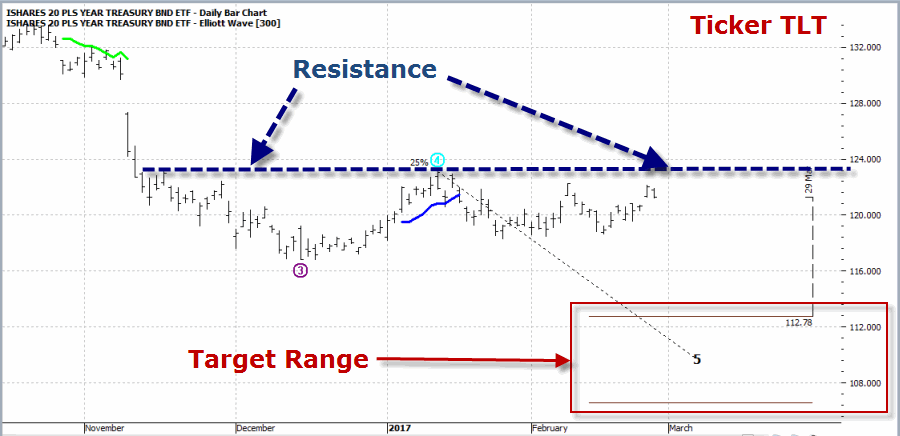
As you can see in Figure 2 the daily Elliott Wave pattern (as calculated by ProfitSource by HUBB) is projecting lower prices for t-bonds.
Figure 2: Courtesy ProfitSource by HUBB
For the record, Elliott Wave counts don’t always pan out. But for now it still counts as a negative influence (at least in my market addled mind)
#3. Price Trend is still Negative
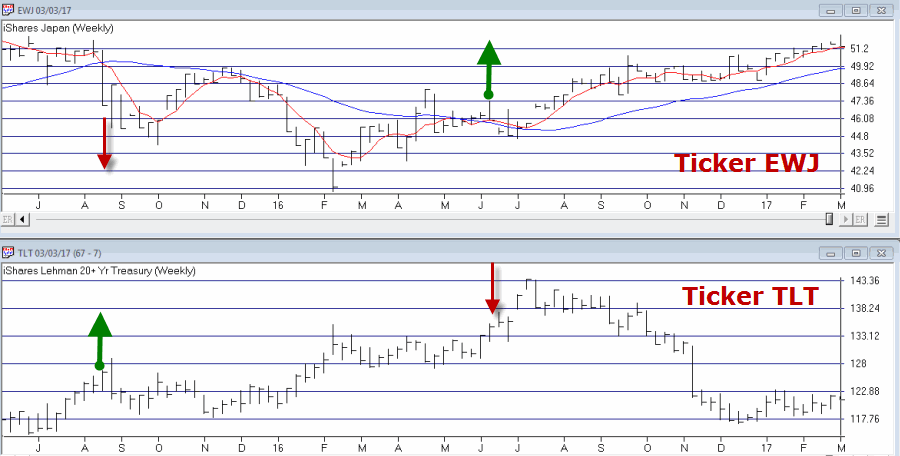
Figure 3 displays the weekly EWJ (Japan ETF) and a weekly chart of TLT. TLT tends to perform poorly when the 5-week moving average for EWJ is above the 30-week moving average for EWJ – which has been the case since June of 2016 and remains the case today.
Figure 3: uptrends tend to accompany downtrends. Courtesy AIQ TradingExpert
Hypothetical Example Trade
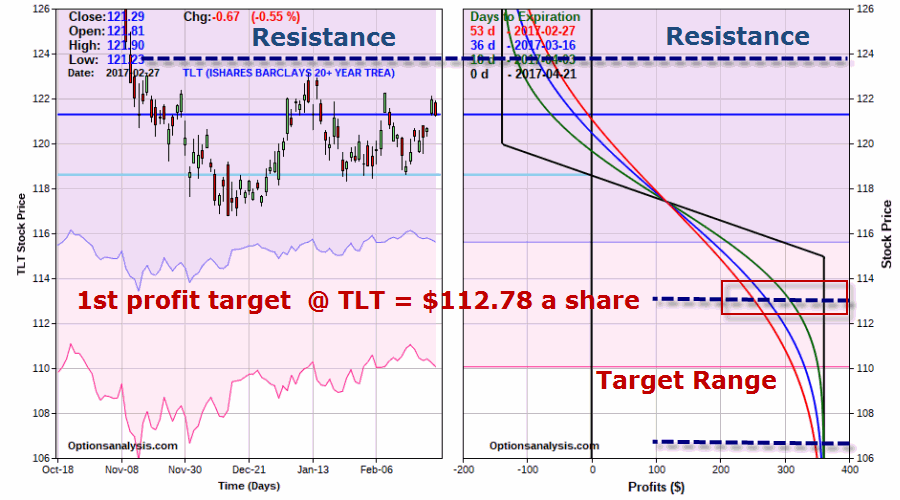
The position displayed in Figures 4 and 5 is referred to as a “bear put spread” and involves:
*Buying 1 Apr2017 TLT 120 Put
*Selling 1 Apr2017 TLT 115 Put
Figure 4: Courtesy www.OptionsAnalysis.com
Figure 5: Courtesy www.OptionsAnalysis.com
A 1-lot costs $139, which represents the maximum risk on the trade. The maximum profit potential is $361. From a trading perspective here is the more relevant way to look at this position:
1) If the “resistance” level is taken out, this trade will lose somewhere between -$60 and -$139, depending on how soon it happens
2) If TLT does decline to the upper Elliott Wave target of $112.78, this trade will show a profit of +$258 and +$363, again depending on how soon that price level is hit.
So the relevant questions for a trader in this hypothetical example are:
1) Do you think there is a chance that t-bond prices will decline between now and April 21st?
2) Do you have $139 bucks you are willing to risk in order to find out?
Here is another “real world” way to look at this hypothetical position:
The Good News is that it appears to have a lot going for it in terms of bearish catalysts / influences, a positive risk to reward ratio and a low dollar risk
The Bad News is that all bonds have to do is rally a little bit and the whole darn thing ends up looking pretty darn stupid in hindsight.
Hence the reason it is called “speculation” and hence the reason for risking a low dollar amount.
Summary
Is this any way to trade t-bonds? Well, it’s one way. Nothing more, nothing less. A simple example of one way to speculate on lower bond prices without betting the ranch.


