In the history of the NBA Finals, no team had ever come back from a 3-1 deficit. Miami Heat believers explained that records were meant to be broken. And Lebron James asked, “Why not us?”
To the dismay of some basketball fanatics, the San Antonio Spurs mercifully disposed of their inferior competition in the fifth game. History did not crumble; rather, it went with the odds. Equally compelling, a relative unknown in Kawhi Leonard earned the Most Valuable Player award for his play in the series; in this instance, history went against the high likelihood that an established superstar would hoist the trophy.
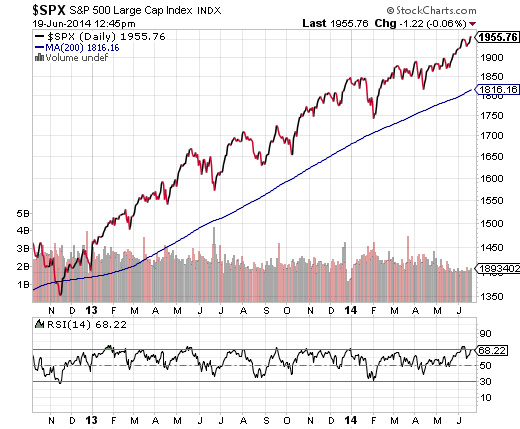
Along these lines, the S&P 500 has traded above its 200-day moving average for 394 trading sessions. That has never occurred in the history of the heralded benchmark. The previous record? 385 trading days in the mid-90s. Granted, it may be difficult to quantify how improbable the occurrence. That said, there’s simply no denying the extraordinary length of time that the bull market uptrend for U.S. large caps has remained intact.
Of course, even when Hank Aaron took down Babe Ruth — even when Barry Bonds broke Aaron’s home run record — time itself eventually settled on a number. Nothing continues indefinitely. So the primary question from my vantage point is, “How long will the S&P 500 continue to defy the odds?”
Not much longer.
It may be true that extraordinary confidence the world’s central banks rate-manipulating policies have removed the fear from the minds of risk-takers. After all, nobody seems to care about the things that would have rattled stocks and higher-yielding assets in the past. Oil prices, teetering economies, regional conflicts from Russia to the Middle East, structural unemployment, inflation-adjusted decline in wages — nothing much matters anymore.
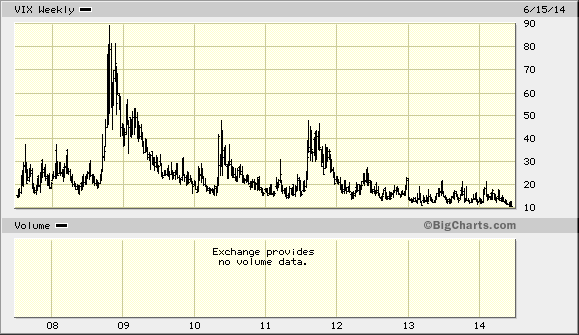
That said, the mere absence of fear is a major concern all on its own. Stock market success in early-to-mid-stage bull markets are famous for climbing a “Wall of Worry.” Late-stage bull markets often see a remarkable amount of complacency. 394 trading days above a long-term trendline? Complacency. A bull-bear spread of adviser sentiment of 45.1 that is higher than previous market tops of 42 in both 10/2007 and 4/2011? Complacency. The CBOE S&P 500 VIX volatility Index -- a.k.a. “the fear gauge” -- pushing to lows not seen since before the previous bear market’s inception? Complacency.
As I recently discussed in “Be Mindful of Reversions to Long-Term Averages,” an astute ETF investor can prepare for eventual change by proactively managing portfolio risk. Embrace a barbell strategy. Seek out more attractive valuations. Even hedge with negatively correlated assets.
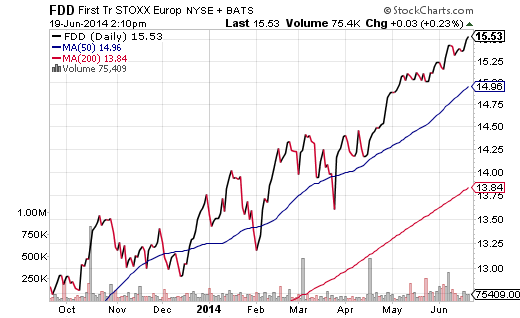
For example, I do not think it is too late for investors to reduce some of the assets in the middle of the risk spectrum (i.e. handle of the barbell), while simultaneously adding to the far left and far right. In the middle, I have pared back on intermediate-term high yield funds like SPDR High Yield (ARCA:JNK). For the far left of the barbell, I have benefited all year long by adding to Vanguard Extended Duration (NYSE:EDV) on the proverbial dips. For the far right, I have added to stock exposure where the valuations are more attractive, the dividends are higher and the central bank stimulus is increasing. Check out iShares MSCI EAFE Value NYSE:EFV) and First Trust European Select Dividend (NYSE:FDD).
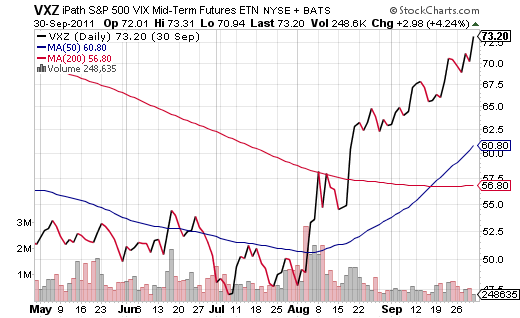
Finally, for those who aggressively trade — and for those who believe a significant correction is imminent — negatively correlated assets can offer portfolio protection. The iPath S&P 500 VIX Mid-Term Futures ETN (NYSE:VXZ) is a buy-n-hold loser. On the other hand, it may mitigate long stock exposure in a sharp sell-off. This exchange-traded note benefited traders during the summertime swoon of 2011 with unrealized gains north of 50%.


