Over the last few years, I have continually battled the “bond bears” about calls for higher rates simply because rates were low.
One of the biggest issues with the predictions of rising 10-year bond yields, which started in earnest in 2013, is they have been consistently wrong. For a bit of history, you can read some of the more recent posts on why I have stated rates can’t rise in the current environment.
(Of course, we have been avid buyers of bonds on “rate pops” in our portfolios during that time frame as well.)
It is this bit of history that I share with you, which brings me to my thoughts today.
Each quarter, I take a look at the “Commitment Of Traders” report to see where professional traders are positioning themselves in the market. Here is an excerpt from the June analysis explaining a bit more about this data.
“The COT (Commitment Of Traders) data, which is exceptionally important, is the sole source of the actual holdings of the three key commodity-trading groups, namely:
The data we are interested in is the second group of Non-Commercial Traders which speculates on where they believe the market is headed.”
In the June report, I discussed the issue with the extremely bullish positioning in interest rates specifically.
“The reversal of the net-long positioning in Treasury bonds will likely push bond yields lower over the next few months. This will accelerate if there is a ‘risk-off’ rotation in the financial markets in the weeks ahead.
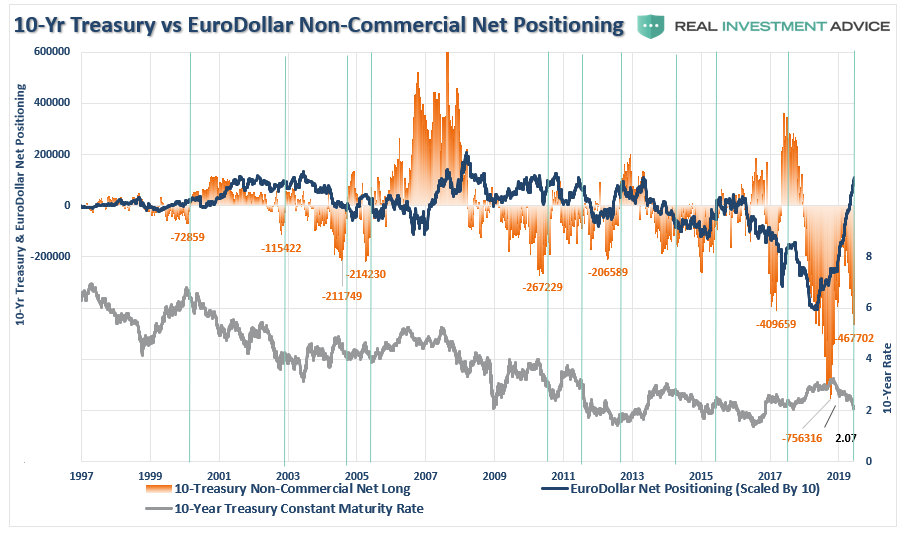
However, as shown in the updated chart below, despite the sharp drop in rates, traders are still betting on a surge in rates and the net-short positioning on the 10-Year Treasury is at the second-highest level on record. Combined with the recent spike in Eurodollar positioning, as noted above, it suggests that there is a high probability that rates will fall further in the months ahead; most likely in concert with the risks of a recession.”
“The chart below looks at net-short positioning ONLY when net-short contracts exceed 100,000. Since peaks in net-short contracts generally coincide with peaks in interest rates, it suggests there is more room for rates to fall currently.”
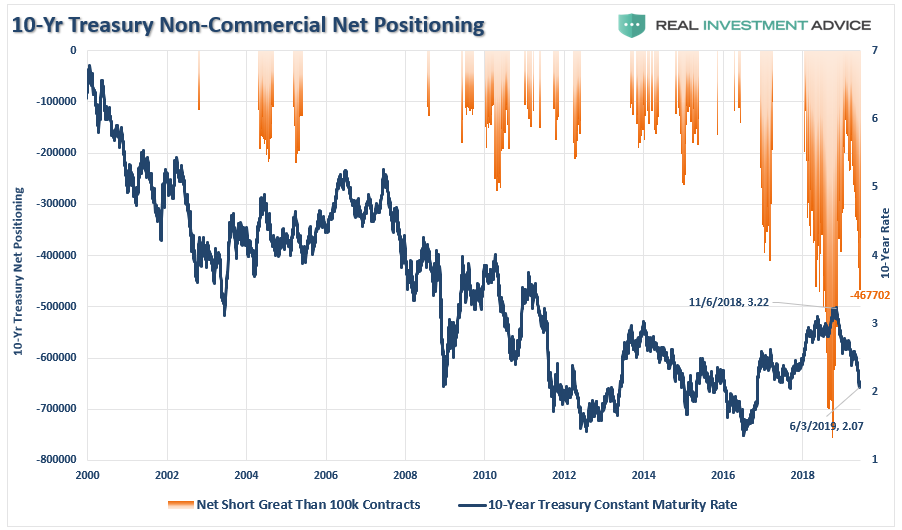
I have updated the last chart to show you where traders are positioned currently.
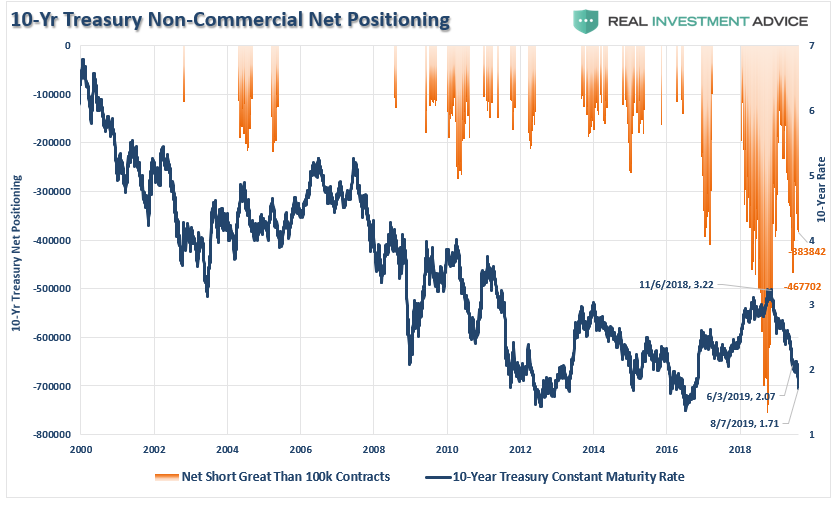
Despite rates falling to 3-year lows, traders are still at some of the most extreme net-short positionings on rates in history. This net short positioning provides “fuel” for further price increases in bonds, and declines in rates, as traders are ultimately forced to cover their positioning.
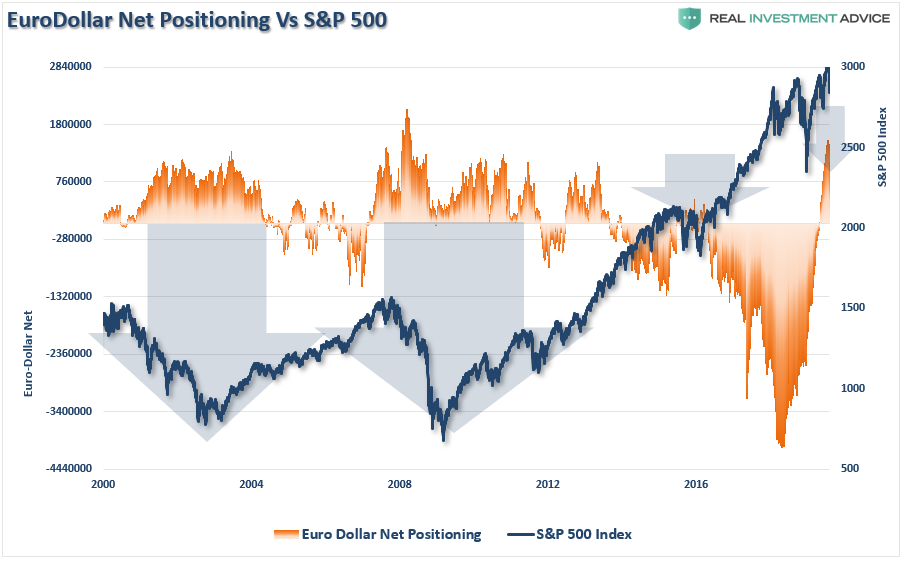
As noted above, the extremely long Eurodollar positioning also suggests a further flight into the safety of Treasuries is likely as a larger mean-reversion in equity prices takes hold.
The Lonely Bull
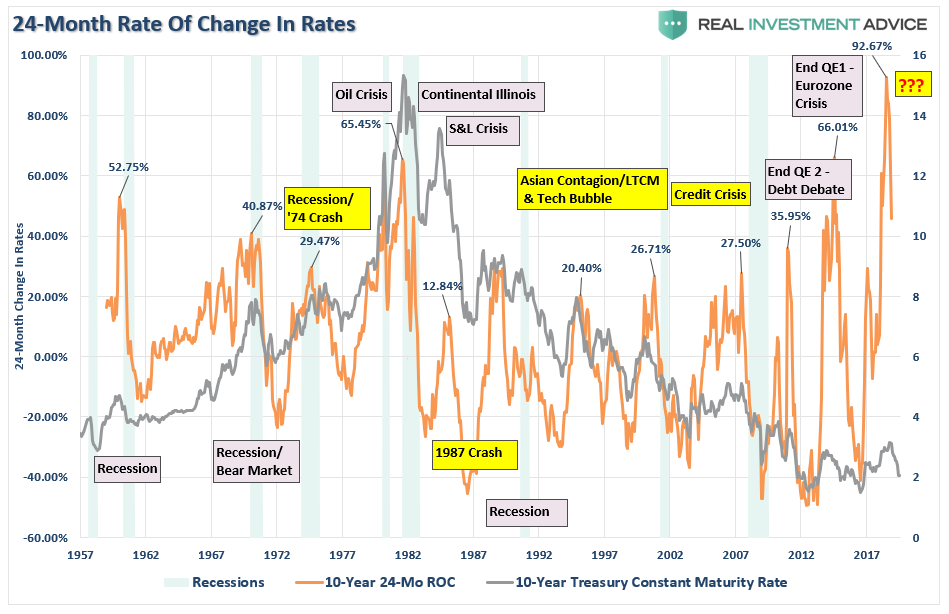
As noted, I have been a “lonely bond bull” for a long time now. While I have repeatedly called for lower rates, due to the actual “economic” backdrop, it was a very out of favor view.All of a sudden, I am no longer lonely.The hardest part about being a contrarian investor, is holding firm to your beliefs even when the data turns against you in the short-term. Such seemed to be the case in early 2018, as a slate of stimulus from tax cuts to natural disasters temporarily boosted economic growth higher.As we warned several times, that bump in economic growth was going to be ephemeral since it was temporary in nature, and funded by deficit spending, rather than an organic shift in economic strength.From a technical perspective, it was also reasonably easy to make a contrarian call when the 24-month rate of change in interest rates hit the highest level in history going back to 1957. (Importantly, note that every previous spike in history coincided with either a crisis, recession, or both.)Currently, rates are extremely extended as investors have decided to seek “safety” over “growth” as uncertainties over the economy, and the ongoing “trade war,” continues to make headlines. The chart below expands on the analysis above.Bonds, and by extension interest rates, are extremely overbought in the short term. It is quite likely that in coming months we will see a bounce in rates to some degree. However, ultimately, the current cycle will not be completed until rates most likely reach ZERO.
Heading To Zero
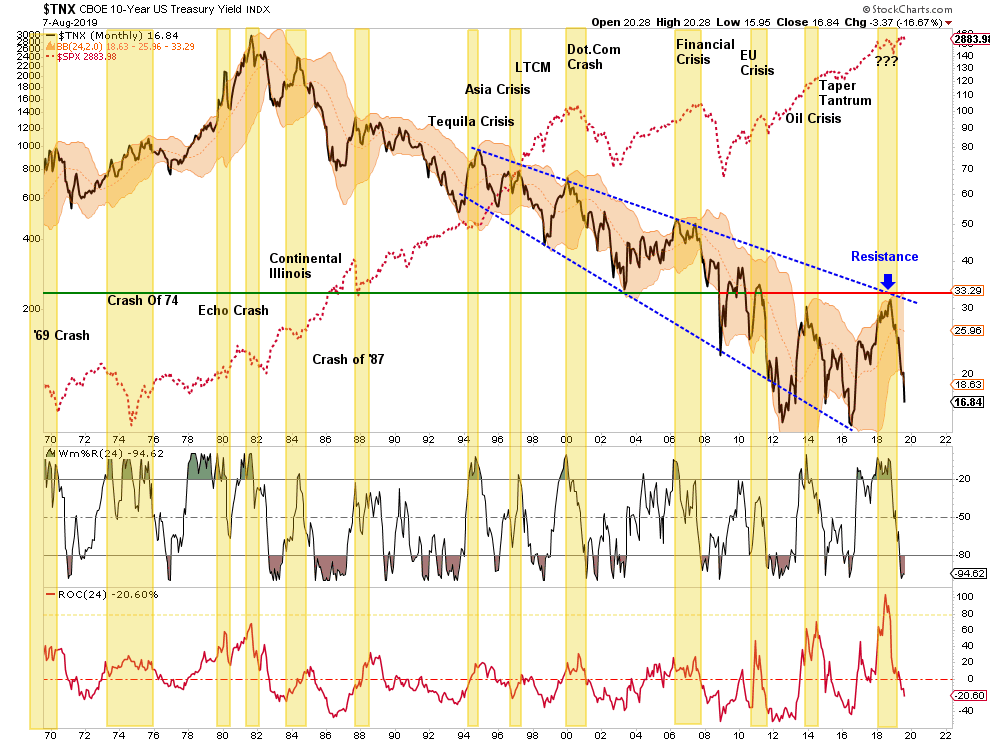
As shown above, rates have remained confined to a near 40-year downtrend, and given the Fed is being pushed to lower rates to ZERO, it is quite likely the 10-year will ultimately approach that level as well. The reason is simply due to the ongoing weakness which continues to plague global economies.
As I just wrote recently:
“The issue of rising borrowing costs spreads through the entire financial ecosystem like a virus. The rise and fall of stock prices have very little to do with the average American the vast majority of whom have no stake in the markets. Interest rates, however, are an entirely different matter and has the most significant effect on the bottom 80% of the economy. Think student loans, auto loans, credit card debt, and mortgages.
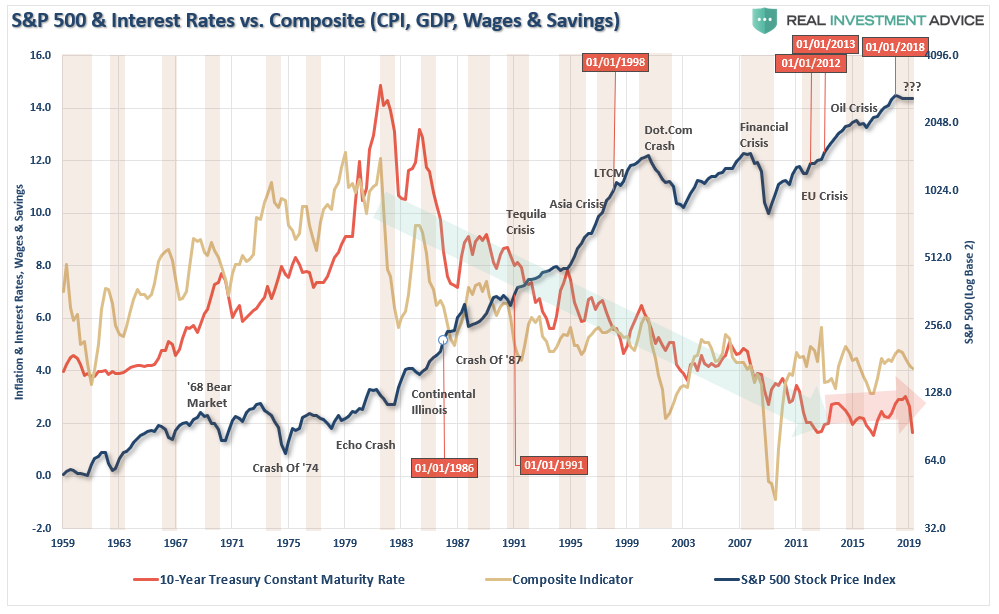
The chart below shows the composite economic indicator of inflation, wages, GDP, and savings as compared to interest rates and the S&P 500. Sharp upticks in rates have historically led to financial events, recessions, market corrections, or a combination of all three.”
Rates are ultimately directly impacted by the strength of economic growth and the demand for credit. While short-term dynamics may move rates, ultimately the fundamentals, combined with the demand for safety and liquidity, will be the ultimate arbiter.
When you have $13 Trillion in negatively yielding sovereign debt, money will flow to the bonds with the highest, and safest, yield. Today, the sovereign debt with the highest yield, and most safety, is the U.S. Treasury.
As money flows into the U.S. Treasuries for safety, security, and return, from both domestic and foreign purchasers, yields are driven lower. (This will be exacerbated by the short-squeeze in bonds as noted above.)
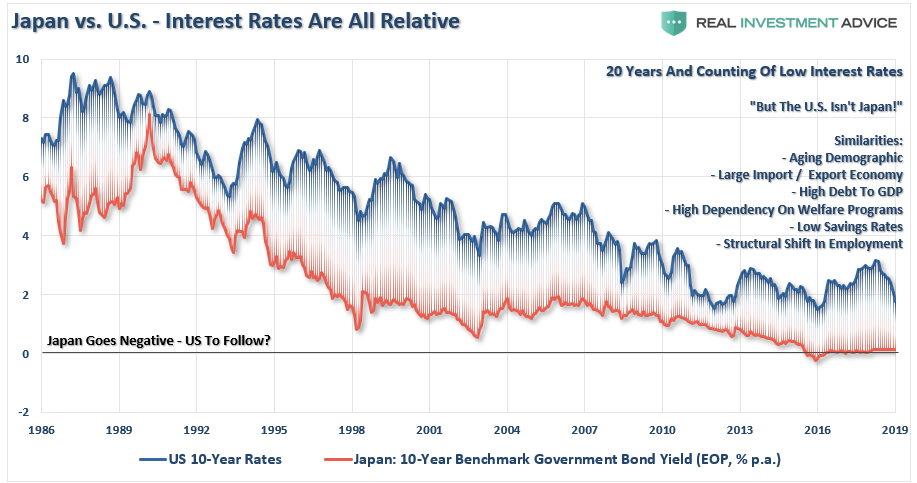
Take Japan, for example. Rates can’t rise in one country while a majority of global economies are pushing low to negative rates. As has been the case over the last 30-years, so goes Japan, so goes the U.S.
Like Japan, every time rates begin to rise, the economy rolls into a recession. The U.S. is already facing many of the same demographic and economic challenges.
Unfortunately, for the current Administration, the reality is that cutting taxes, tariffs, and sharp increases in debt, is unlikely to change the outcome in the U.S. The reason is simply that monetary interventions, and government spending, don’t create organic, sustainable, economic growth. Simply pulling forward future consumption through monetary policy continues to leave an ever-growing void in the future that must be filled.
Eventually, the void will be too great to fill.
While the Fed was hiking rates on expectations of stronger economic growth and inflation, we stated several times that doing so would have negative consequences over a very short period. It didn’t take long for the Fed to realize the same.
At the end of July, the Fed cut rates for the first time in a decade. They are also stopping their “Q.T.” program to prepare for the restart of “Q.E.” It is all precisely as we said they would on December 24th of 2018:
“At some point, the Federal Reserve is going to step back in and reverse their policy back to ‘Quantitative Easing’ and lowering Fed Funds back to the zero bound. When that occurs, rates will not only go to 1.5%, but closer to Zero, and maybe even negative.”
Becoming A Raving Stock Bull
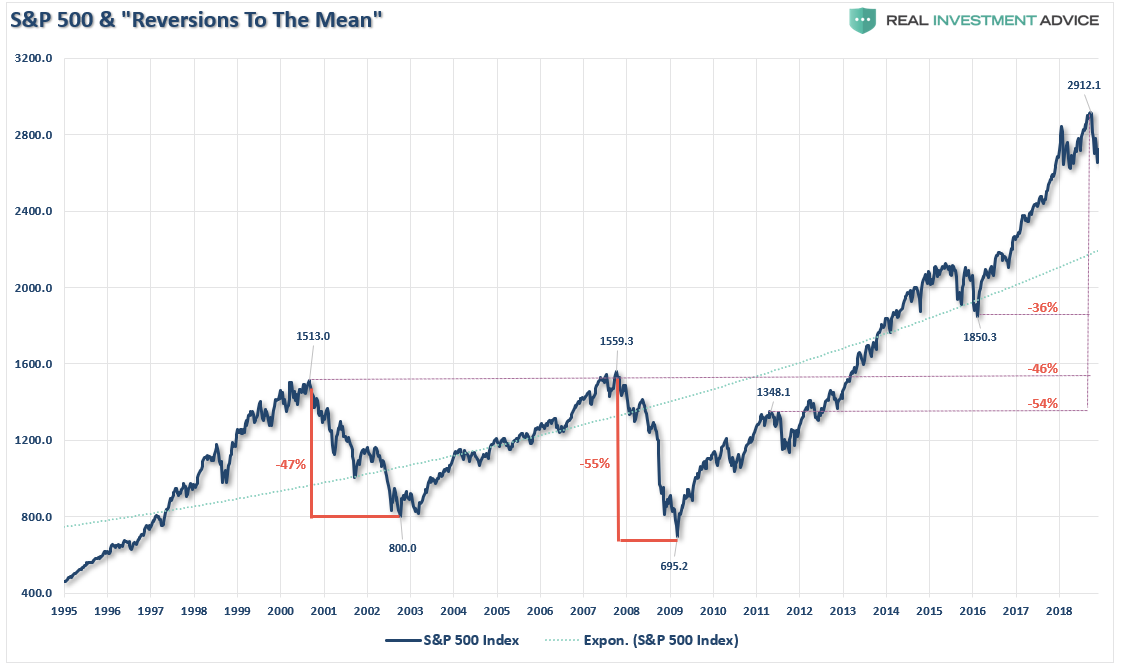
In the next few quarters, we are likely going to deal with an economic recession combined with a mean-reverting event in the market. Another 50% correction, as we have seen previously, is very possible due to the underlying debt and pension risk. While timing is always difficult, the probabilities are very high.
“What causes the next correction is always unknown until after the fact. However, there are ample warnings that suggest the current cycle may be closer to its inevitable conclusion than many currently believe. There are many factors that can, and will, contribute to the eventual correction which will ‘feed’ on the unwinding of excessive exuberance, valuations, leverage, and deviations from long-term averages.
The biggest risk to investors currently is the magnitude of the next retracement. As shown below the range of potential reversions runs from 36% to more than 54%.”
For investors, this is where the real opportunity exists to buy equities. Valuations will be cheap, dividends will be elevated, and the risk/reward dynamics will clearly be in favor of equity ownership.
On the other hand, bonds will be at their maximum value (rates at zero leave little upside for capital appreciation reducing total return from the investment.)
At such a crossroad, allocation models need to be shifted, just as they were in 2003 and 2009, to be primarily invested in equities.
On the bond side of the allocation will be opportunities in busted convertibles, bonds of companies forced into reorganization, and the debt of companies deeply depressed in price due to forced liquidations by investors and pension funds but which have fundamentally strong balance sheets.
The return to value will be a great opportunity for investors to capitalize providing they weren’t wiped out in the previous decline. Unfortunately, this won’t be the case for most.
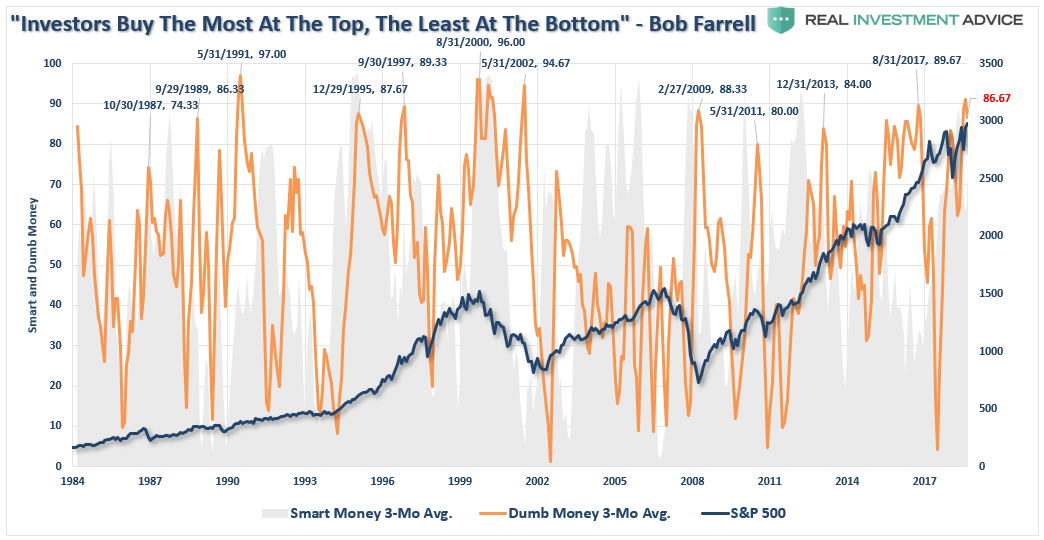
This is why risk management, particularly at this juncture of the investment cycle, is so important. If you don’t “survive” the coming “bear market,’ you can’t take advantage of the next “great stock bull market.”
Want to be a stock bull? Your chance is coming.
