🐂 Not all bull runs are created equal. November’s AI picks include 5 stocks up +20% eachUnlock Stocks

Amazon, S&P 500 Updates: It's All About Revenue And YoY Growth

Published 08/27/2017, 12:13 AM
Updated 07/09/2023, 06:31 AM
US500
-
AMZN
-
WFM
-
WMT
-

“Damn it – don’t ever trust your instincts” – John Cusack as Martin Blank in the all-time-great “Grosse Pointe Blank”

Here is a Marketwatch article written by Mark Hulbert on Amazon (NASDAQ:AMZN). I don't know Mark, but while the article might be accurate on the direction of Amazon’s stock – at least for the near-term – the logic is flawed.

Here is a chart of Amazon:
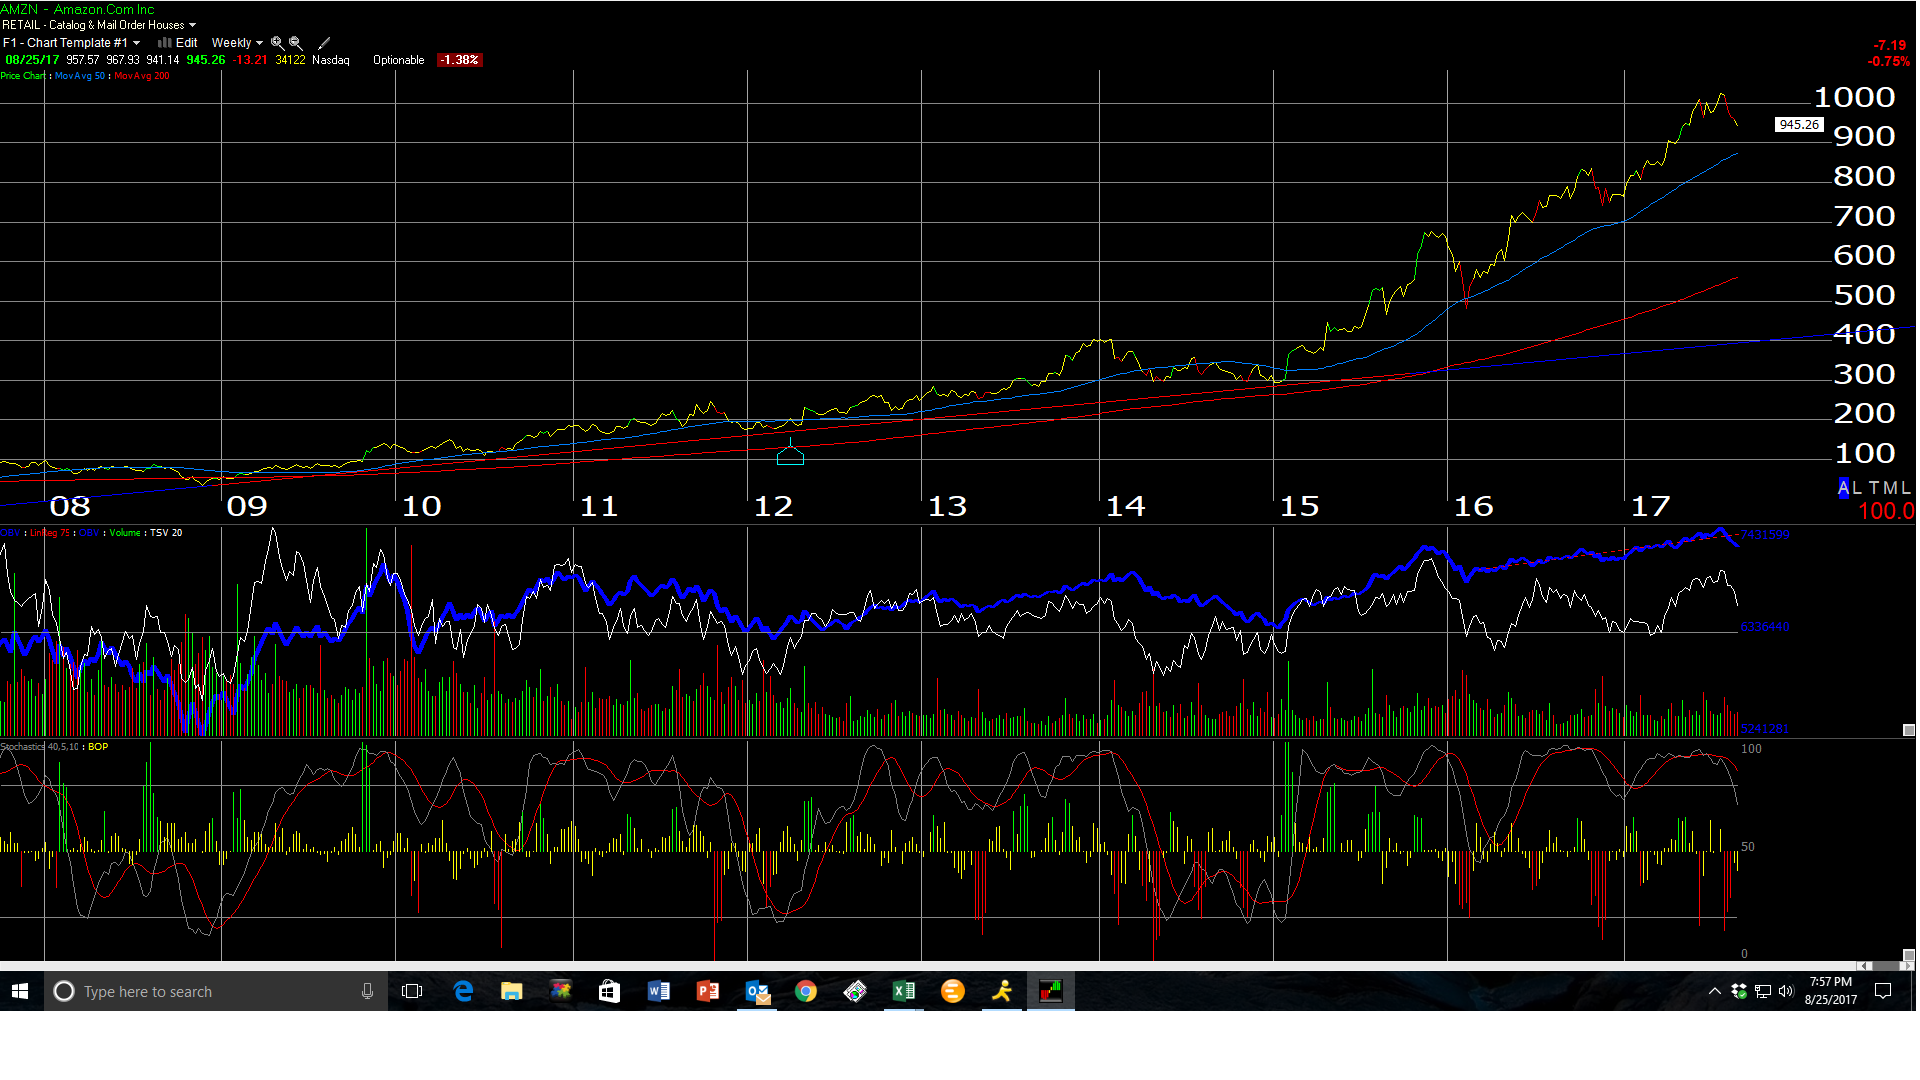
AMZN Weekly Chart

Not trying to pick on Mark, but Amazon has been flagged by a lot of analysts, Jim Cramer, technicians, etc. as looking vulnerable, and all have been right and will likely be right, at least for a little while longer.

Here is a spreadsheet thrown together on Amazon showing trends in EPS and revenue estimates.

Amazon opened the year trading at roughly $750 and then peaked at $1,083 on July 27th, even as EPS estimates were falling and revenue estimates were somewhat “mixed”.

Actually the stock peaked right around the time positive sentiment went off the charts on Amazon, and after the Whole Foods (NASDAQ:WFM) acquisition.

However, here’s the thing: the only metric that has ever really mattered with Amazon is revenue growth, and forward revenue estimate revisions have turned higher once again (see the spreadsheet).

Amazon earnings estimates have been volatile for years based on Amazon’s investment cycles.

Amazon is fine, and with “grocery” being a substantial chunk of the $5.5 – $6 bl in US retail sales, and 53% of Wal-Mart (NYSE:WMT) revenue, the Whole Foods deal is going to up-end the US grocery business.

Amazon has good support in the $900 area. Remember, from late 2015 through the first week of February, 2016 Amazon corrected 32%, from $700 down to $470.

This correction is mild for Amazon.

S&P 500 earnings (by the numbers):

  • Forward 4-quarter estimate: $138.40
  • P.E ratio: 17.6(x)
  • PEG ratio: 1.77(x)
  • S&P 500 earnings yield: 5.67%
  • Year-over-year growth of forward estimate: +9.95% (almost 10%)

Analysis / conclusion: The year-over-year growth of the forward estimate is almost 10% – should start a betting pool to see the week the estimate gets over 10%.

Latest comments

Loading next article…
Risk Disclosure: Trading in financial instruments and/or cryptocurrencies involves high risks including the risk of losing some, or all, of your investment amount, and may not be suitable for all investors. Prices of cryptocurrencies are extremely volatile and may be affected by external factors such as financial, regulatory or political events. Trading on margin increases the financial risks.
Before deciding to trade in financial instrument or cryptocurrencies you should be fully informed of the risks and costs associated with trading the financial markets, carefully consider your investment objectives, level of experience, and risk appetite, and seek professional advice where needed.
Fusion Media would like to remind you that the data contained in this website is not necessarily real-time nor accurate. The data and prices on the website are not necessarily provided by any market or exchange, but may be provided by market makers, and so prices may not be accurate and may differ from the actual price at any given market, meaning prices are indicative and not appropriate for trading purposes. Fusion Media and any provider of the data contained in this website will not accept liability for any loss or damage as a result of your trading, or your reliance on the information contained within this website.
It is prohibited to use, store, reproduce, display, modify, transmit or distribute the data contained in this website without the explicit prior written permission of Fusion Media and/or the data provider. All intellectual property rights are reserved by the providers and/or the exchange providing the data contained in this website.
Fusion Media may be compensated by the advertisers that appear on the website, based on your interaction with the advertisements or advertisers.
© 2007-2024 - Fusion Media Limited. All Rights Reserved.