S&P 500 Sky High. What’ll It Take To See Real Selling?

Published 08/12/2020, 12:40 AM
Updated 07/09/2023, 06:31 AM
US500
-
EWZ
-

Yesterday, the S&P 500 reached its highest point in human history. Perhaps to give the 3 bears left on the entire planet a wisp of hope, things went south later in the day, and we wound up with a bearish engulfing pattern, thus aborting the chance of having ten freakin’ green days in a row.
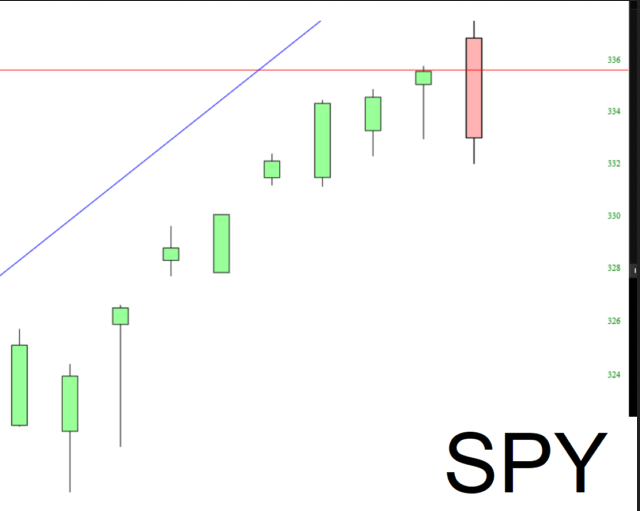
SPY Chart

I have had special contempt lately for small caps. I abandoned my IWM put position a few days ago (committing myself heart and soul instead of to my iShares MSCI Brazil Capped ETF (NYSE:EWZputs), yet I still watch it closely.

There are two important levels we’d need to break on the small caps to get things kosher for the bears again. The first would be a failure at 1547 on the /RTY:
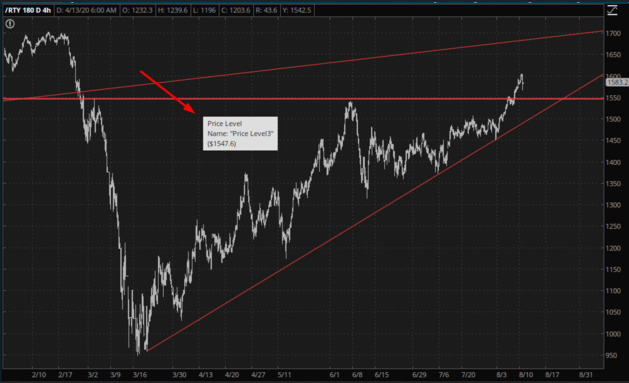
RTY - 4 Hr Chart

If we manage to do that, thus, negating the cup-with-handle breakout, then we’d need to do something even tougher, which is bust below 1500, which is roughly where the ascending trendline support is. This line is intact since the mid-March bottom.
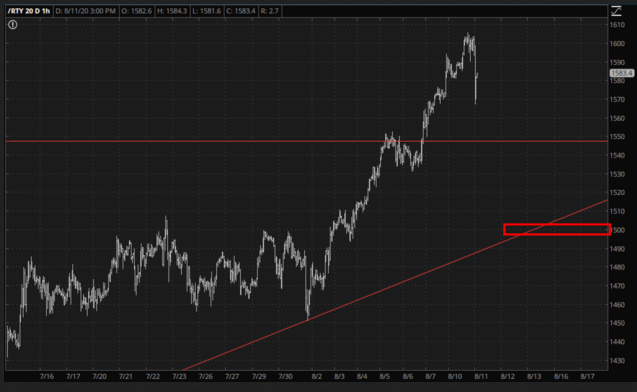
RTY 1 Hr Chart

Things are sky-high and expensive right now. It would do my soul good to see some serious selling resume.
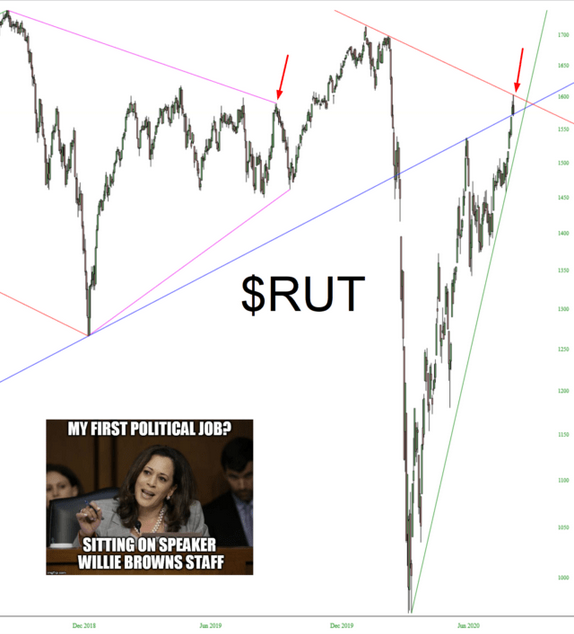
RUT Chart

Latest comments

Loading next article…
Risk Disclosure: Trading in financial instruments and/or cryptocurrencies involves high risks including the risk of losing some, or all, of your investment amount, and may not be suitable for all investors. Prices of cryptocurrencies are extremely volatile and may be affected by external factors such as financial, regulatory or political events. Trading on margin increases the financial risks.
Before deciding to trade in financial instrument or cryptocurrencies you should be fully informed of the risks and costs associated with trading the financial markets, carefully consider your investment objectives, level of experience, and risk appetite, and seek professional advice where needed.
Fusion Media would like to remind you that the data contained in this website is not necessarily real-time nor accurate. The data and prices on the website are not necessarily provided by any market or exchange, but may be provided by market makers, and so prices may not be accurate and may differ from the actual price at any given market, meaning prices are indicative and not appropriate for trading purposes. Fusion Media and any provider of the data contained in this website will not accept liability for any loss or damage as a result of your trading, or your reliance on the information contained within this website.
It is prohibited to use, store, reproduce, display, modify, transmit or distribute the data contained in this website without the explicit prior written permission of Fusion Media and/or the data provider. All intellectual property rights are reserved by the providers and/or the exchange providing the data contained in this website.
Fusion Media may be compensated by the advertisers that appear on the website, based on your interaction with the advertisements or advertisers.
© 2007-2025 - Fusion Media Limited. All Rights Reserved.