It’s 2015; a new year and a time for reflection, especially on what the future might bring in the world of currency trading. The current long-term thinking is that the U.S. dollar will dominate the forex arena, much as it did in 2014, but that view is for the longer term.
The near-term view is in doubt, although there is no other market sector across the globe that is presently pounding the drum to signify its nascent transcendence. Most analysts have put aside their foggy crystal balls and resorted to searching the past for clues of what might come. Some of these efforts defy what could be termed credulity.
When in doubt, look for poignant patterns or arcane indicators yielding red flags galore. The glory that comes with being the first to make a cogent forecast that actually bares fruit is what drives these folks, a kind of contest where failure is the expected norm, but without the possibility of constant condemnation for having tried.
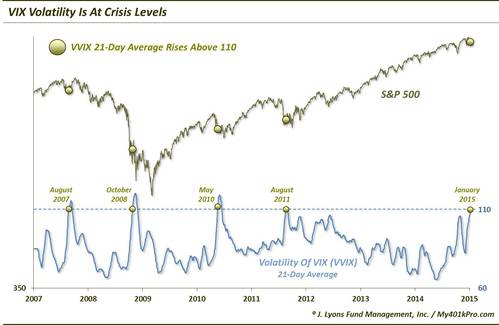
Of all the crazy ongoing attempts out there to grab the golden ring, Dana Lyons of J. Lyons Fund Management at least deserves an “A” for effort for discovering what has to be called a needle in a haystack. This analyst also admits that the significance of the chart below is baffling, but it is interesting from several perspectives:

Forecasting in any market requires a degree of skill. One must weigh the risks at hand, the economic and political climate, coquettishness of central bankers, current trends if they are prevalent, and last of all, an assessment of the luck factor. The ability to predict that last one goes hand in hand with stability, or the lack of risk, if you will. For this reason, this rather circular logic path reverts back to a basic risk assessment of the market, both global and domestic. The global economy is so entwined these days that local conditions are not enough if a high probability of forecast success is desired.
The easiest way to gauge prevailing risk sentiments is to review the Chicago Board of Trade’s volatility index, better known simply as the VIX, its trademarked ticker symbol. A simple web-based definition states that the VIX is:
“a popular measure of the implied volatility of S&P 500 index options. Often referred to as the fear index or the fear gauge, it represents one measure of the market's expectation of stock market volatility over the next 30-day period.”
The VIX does not look at historical volatility. It relies rather on the current flow of prices for futures options, a key variable being an assumed or implied volatility. The figure rates how much the S&P 500 might change over twelve months on average, a view derived from the consensus of traders in the market for the next month.
Dana Lyons did not stop here. It seems that the CBOE began publishing a “VVIX” back in 2007. This clever concoction actually measures the rate of change of the VIX, or, if you remember your calculus classes from way back when, it is a derivative of a derivative. Isaac Newton, the Father of Calculus, might rejoice in his grave to hear this, but Lyons took one more leap of faith and used 21-Day Moving Averages to smooth out the “noise” in the data. The conclusion was that the “VVIX” has hit a peak that has only been traversed on four previous occasions, each a bad event in the historical record.
Are we headed for a crash? Even Lyons does not go that far, admonishing that, “This is another one for the “Hmmm” pile.” My guess is that it may be an over-correction for the long period of low volatility that plagued 2014, but only time will tell.
Disclaimer: Trading Foreign Exchange on margin carries a high level of risk and may not be suitable for all investors. The possibility exists that you could lose more than your initial deposit. The high degree of leverage can work against you as well as for you.