Technical expert Michael Ballanger discusses current market fluctuations and the gold and silver markets.
As I watched Wednesday's CPI (inflation) number reported by the Commerce Department, I was immediately reminded of that classic scene from legendary WWII flick "Casablanca," where Claude Rains, playing police Captain Renault (PA:RENA), shuts down Humphrey Bogart's casino/nightclub with the immortal words, "I shocked—SHOCKED—to find out that gambling is going on in here!" The croupier hands him a wad of bills—"Your winnings, sir"—to which he says, "Oh thank you very much. Now everyone out of here!"
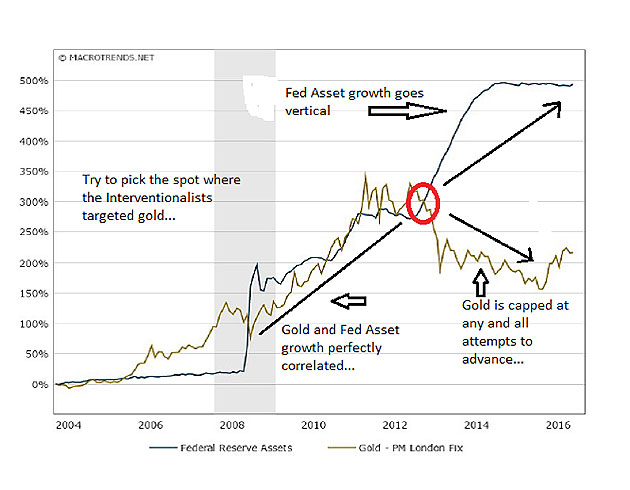
Well, I was shocked—SHOCKED, I tell you—to see that the U.S. inflation numbers came in a tad "hot." After all, the Fed has added some $5 trillion in additional "assets" to its balance sheet since 2008 and encouraged its foreign central bank cousins to do the same, which they have done with even greater enthusiasm. The movement toward serial currency-trashing has had us all awaiting the inevitable return of 1970s-style inflation, but thanks to the creative accounting and fictitious reporting, inflation is seen as "tame" by mostly everyone—but especially the financial media and "bond-badeers."
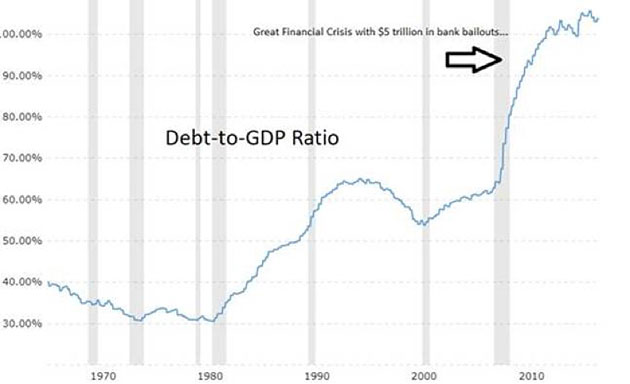
The U.S. debt-to-GDP ratio has been increasing every year since 1980 with only a brief respite during the tech boom of the late '90s, and that has been a global theme of commonality as fiscal recklessness became the clarion call for Baby Boomers the world over. Nearly 10 years of financial repression has finally lifted as bond yields are rising to levels never quite seen by the legions of Millennials now trading for their livelihoods.
The expansion of the Fed balance sheet has long been a source of fascination for me as I could never understand how any entity owned by its members (which are banks that are required to keep a minimum of reserves on hand and must report financial positions) could be allowed to buy trillions of dollars of toxic paper from its members in order for those members to avoid bankruptcy—and then report those noxious purchases as "assets" that remain on the books at book value. If they were threatening to sink the member banks, how can they be booked at face value or par?
Should the Fed not report them as "non-performing loans," leaving a large hole in that balance sheet? Should the Fed, which is not a part of the U.S. government, not be audited, as are its members ("owners")? Why can the Fed buy, sell, and short (think volatility and gold) infinite amounts of anything and everything without ever getting a margin call? Are you not shocked—SHOCKED—that the Captain Renault of bond vigilante-ism isn't closing down that casino?
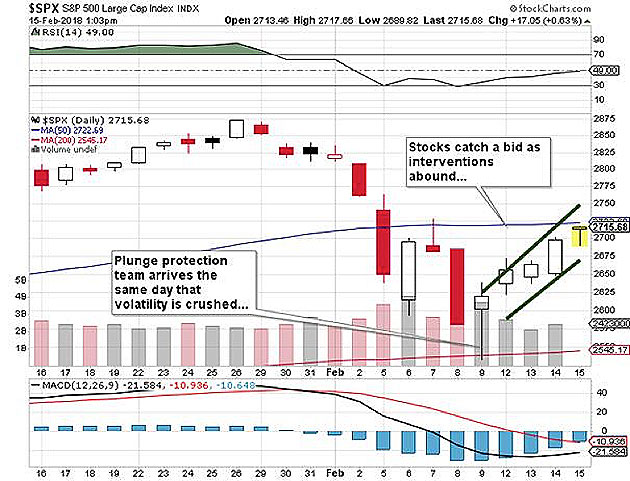
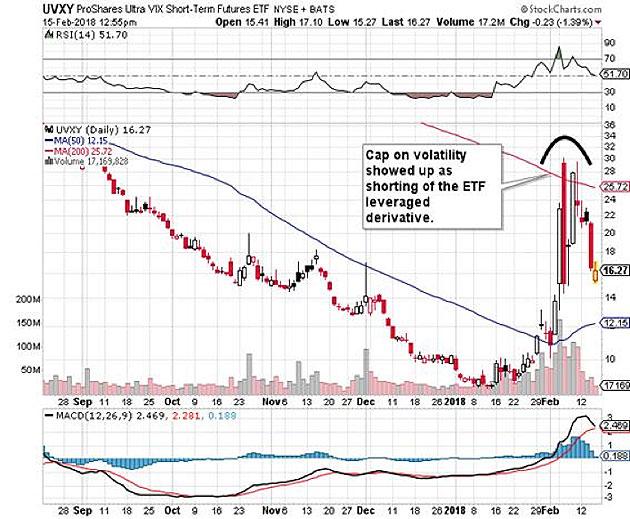
Stocks caught an enormous bid this past week after the ice-water wake-up call of the previous week, but as I wrote about in last week's missive, you would have to be a complete fool to think that there would not be a "response" from 33 Liberty (NY Fed) and from the various serial interveners around the world. The volatility we saw last week spooked the politico-banker elite to the extent that we immediately witnessed dramatic moves to suppress the sudden and violent short covering in the VIX derivatives attached to equity market volatility.
The 1,500-point swings in the Dow Jones were moved upon quickly, and by Monday afternoon, the "Buy-the-Dippers" had absorbed literally all of the panicky supply and voila! The Dow Jones now resides some 1,500 points off the lows and about 1,500 points from the all-time high. You see, everyone now agrees that one must never, ever underestimate the replacement power of stocks in a (hyper) inflationary spiral. So a "hot CPI" is bullish as hell, right?
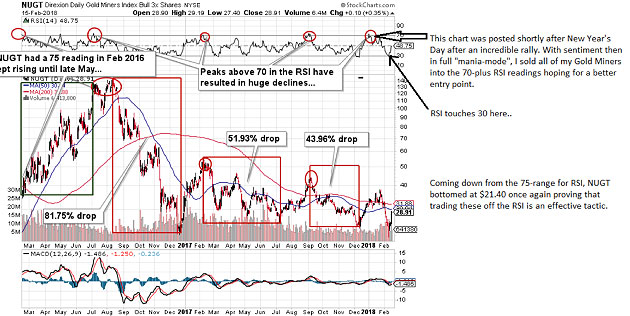
Platitudes aside, I want to put to rest any notions that I have changed my opinion in any way on gold and silver looking out to the balance of 2018. Just to review, in late January I posted the chart shown below and made the case that no matter what the bloggers will tell you, the miners have a history of getting sold when the RSI moves above 70. The high for the December-January rally for Direxion Daily Gold Miners Bull 3X Shares (NYSE:NUGT) was $37.96; the sell point for me was $35.80. The low print last Friday was $21.40; my entry was $23.80.
One week ago, I was a buyer of the leveraged Junior Miner ETF (NYSE:JNUG) at $13.35 (20%) and watched it crater to $11.34, creating all sorts of problems for canine pets, adoring spouses, FedEx (NYSE:FDX) delivery personnel, and call-center employees. In dealing with issues related to "poor trading," I often times get caught up in semi-violent mood swings resulting in harsh responses to challenges such as overly-bound, impossible-to-open FedEx packages and overly-polite, impossible-to-understand bank support staff.
Owing these emotional whipsaws to my way-too-early JNUG entry, all around me had to suffer until the past couple of days, because today NUGT closed at $28.91 and the JNUG at $15.91. Needless to say, calm has now returned to the household as the miners are hitting on all cylinders; the metals are again firming up, and Fido has returned from under the toolshed.
I eagerly anticipate results from Stakeholder Gold Corp.'s (V:SRC) Goldstorm project, where the first hole in a 10-hole project has been drilled to an elevation of just above the water table at 6,000 feet (above sea level). Fingers and toes are crossed but since the shares have now pulled back from the $13M to $8M of market cap last week during the meltdown, there is no longer any speculative anticipation built into the share price. The company is spending $$2.5M over the next three years to earn 100%, so there is a lot of drilling ahead. And with such a big land position tied on Seabridge Gold Inc.'s (TO:SEA, SG:SEA) Snowstorm Project, 2018 will be an active exploration year for the area.
As this is being finished, gold is trading up through $1,360 again, but once again silver is lagging, taking the silver:gold ratio to 80.71. Hard to believe that in 2001, I was buying silver in the $4.00 range at the same ratio to gold—10 years later, it was at $50.
By the way, remember that package that was driving me crazy on Wednesday with industrial-strength packing tape resisting my sharpest box cutters? It was the most beautiful set of five 100-ounce silver bars from the Royal Canadian Mint. My money resides resolutely in the vicinity of my mouth.
Disclosure: 1) Michael J. Ballanger: I, or members of my immediate household or family, own shares of the following companies mentioned in this article: Stakeholder Gold Corp. I personally am, or members of my immediate household or family are, paid by the following companies mentioned in this article: None. My company has a financial relationship with the following companies referred to in this article: Stakeholder Gold Corporation. I determined which companies would be included in this article based on my research and understanding of the sector. Additional disclosures are below.
- English (UK)
- English (India)
- English (Canada)
- English (Australia)
- English (South Africa)
- English (Philippines)
- English (Nigeria)
- Deutsch
- Español (España)
- Español (México)
- Français
- Italiano
- Nederlands
- Português (Portugal)
- Polski
- Português (Brasil)
- Русский
- Türkçe
- العربية
- Ελληνικά
- Svenska
- Suomi
- עברית
- 日本語
- 한국어
- 简体中文
- 繁體中文
- Bahasa Indonesia
- Bahasa Melayu
- ไทย
- Tiếng Việt
- हिंदी
What The Markets Have In Common With The Film 'Casablanca'
Published 02/19/2018, 01:47 AM
Updated 07/09/2023, 06:31 AM
What The Markets Have In Common With The Film 'Casablanca'
Latest comments
Loading next article…
Install Our App
Risk Disclosure: Trading in financial instruments and/or cryptocurrencies involves high risks including the risk of losing some, or all, of your investment amount, and may not be suitable for all investors. Prices of cryptocurrencies are extremely volatile and may be affected by external factors such as financial, regulatory or political events. Trading on margin increases the financial risks.
Before deciding to trade in financial instrument or cryptocurrencies you should be fully informed of the risks and costs associated with trading the financial markets, carefully consider your investment objectives, level of experience, and risk appetite, and seek professional advice where needed.
Fusion Media would like to remind you that the data contained in this website is not necessarily real-time nor accurate. The data and prices on the website are not necessarily provided by any market or exchange, but may be provided by market makers, and so prices may not be accurate and may differ from the actual price at any given market, meaning prices are indicative and not appropriate for trading purposes. Fusion Media and any provider of the data contained in this website will not accept liability for any loss or damage as a result of your trading, or your reliance on the information contained within this website.
It is prohibited to use, store, reproduce, display, modify, transmit or distribute the data contained in this website without the explicit prior written permission of Fusion Media and/or the data provider. All intellectual property rights are reserved by the providers and/or the exchange providing the data contained in this website.
Fusion Media may be compensated by the advertisers that appear on the website, based on your interaction with the advertisements or advertisers.
© 2007-2025 - Fusion Media Limited. All Rights Reserved.
