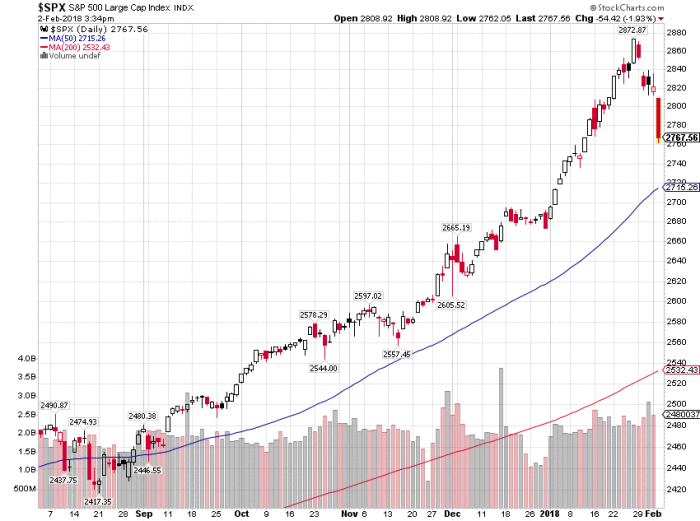
Well its been awhile since investors felt what it’s like to experience a correction. As a result of todays close, the markets have now experienced its largest pullback in almost two years.
The average intra-year decline is around 15%, when the markets haven’t pulled back more than 3% since 2016. Stocks are called risk assets for a reason. Sometimes they do go down. And when they go down, it’s usually sharp and fast. Investors need to be aware of this and not allow themselves to get caught up in the short term noise, even though this is much easier said than done! If you’re prone to get anxious on days like this, it’s best to shut down the computer screen and change the channel to something else until the dust settles. Remember, not every correction leads to a crash. A crash is a low probability event in and of itself, and even rarer to experience one without an economic recession. You’d have to go back to 1987 (30+ years) to find such an event.
So what happened?
Two things in my opinion:
1) Overdue for pullback.
As I mentioned in the intro, the market hasn’t pulled back more than 3% in almost two years. This is highly unusual and a reversion to the mean is to be expected at some point.

Take a look at the above chart to see how far above the market is/was trading above its 50 and 200 day moving average. This is unsustainable in the near term.
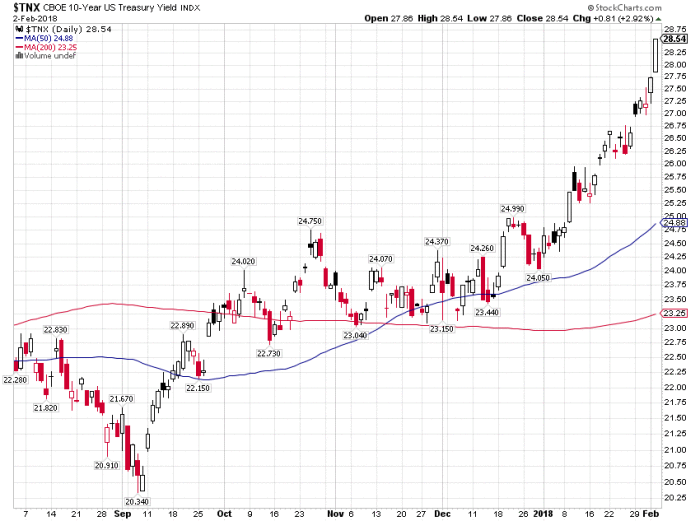
2) The sharp increase in interest rates.

The benchmark 10 year treasury rate has risen almost 50% since September. This is because of good reasons, the economy is improving, corporate profits are at all-time highs (expected to grow 16% for 2018) along with tax reform and infrastructure spending benefits as well.
However the rapid pace of the advance in rates is what the market needs to now “reprice”. Cash flows are discounted by the risk free rate, and the 10 year treasury rate is subtracted from the earnings yield on the S&P 500 to come up with the “equity risk premium”. Which basically means that as rates rise, fixed income becomes more competitive to stocks, thus potentially reducing valuations on stocks. I don’t see this as being an issue unless the 10 year treasury rate gets above the 3.5% – 4% range.

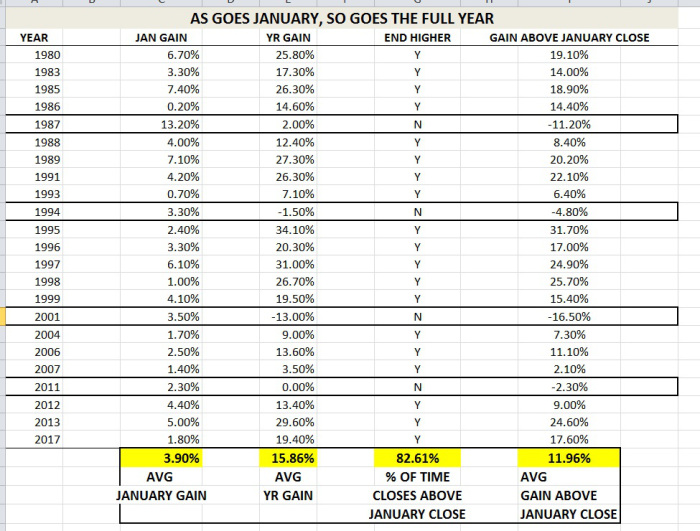
Some good news. If we look at historical returns on the S&P 500, each year that included a positive January performance is included in the attached chart. The outcome looks impressive. 82.6% of the time the stock market closes the year above the January highs. The average annual gains are around 16%, and the average gain above the January close has been about 12% higher.

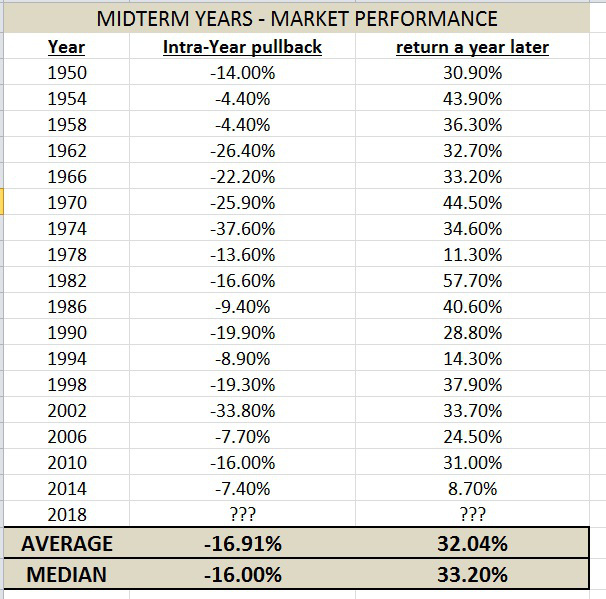
Also looking at the market performance during midterm election years since 1950, we see precedence for volatility.
The average and median intra-year pullback is 16-17%, while the total return a year later averages 32%. This means we should be ready for a correction, but staying the course should prove most prudent in the end.
This is good data to look at, especially on a bad day like today. It doesn’t tell us what the future holds (this year could be one of the 18% of times the market closes the year below the January close) though.
Investors should also keep in mind there’s positives about stock declines. Dividend yields and future expected returns go up.
Conclusion: No one knows whether Friday’s decline is the end of the pullback, or the beginning of a correction in the 5-15% variety. Economic fundamentals continue to improve, financial stress is low, corporate profits are high, interest rates are rising but are still well below average, and valuations are reasonable in comparison to rates and inflation.
The key point is to not let yourself be swayed by short term market reactions in either direction. Don’t get caught up in the hype and get aggressive when markets are rising rapidly. And don’t get too low when the inevitable volatility events occur either.
