2 weeks ago we already correctly showed that the low VIX was no reason for concern and look where the markets are now... All are at new All Time Highs (ATHs). That's the power of objective, fact-based technical analyses. Our members are profiting handsomely off that.
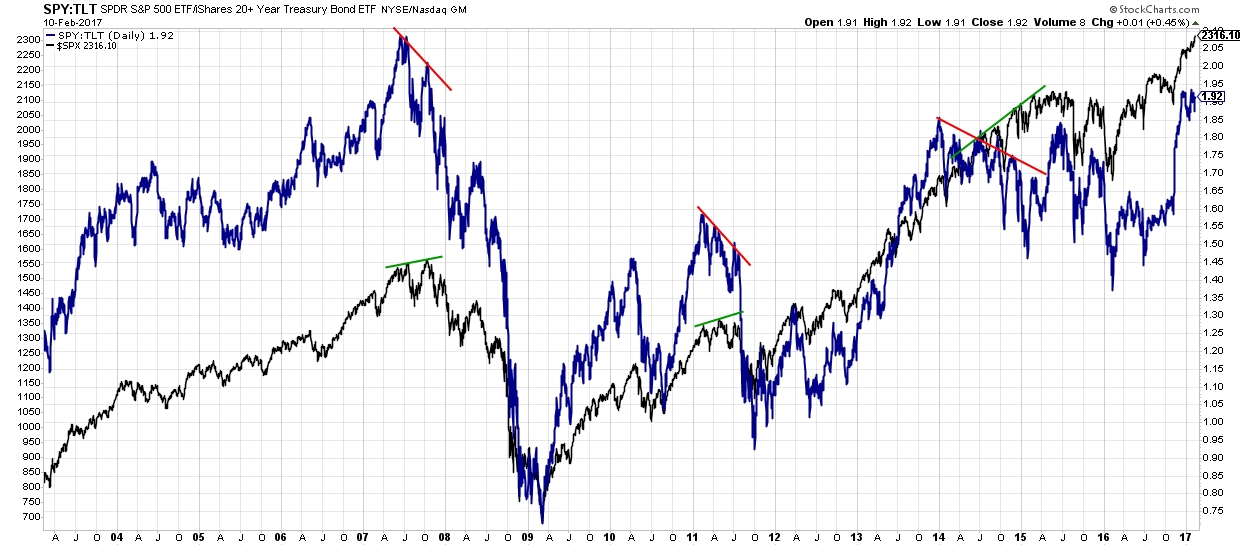
Today we will take a look at another solid indicator: the SPY:TLT ratio. "The what?" I hear you say? Let me explain: the ratio between the SPDR S&P 500 (NYSE:SPY) and the iShares 20+ Year Treasury Bond (NASDAQ:TLT) can foretell of pending larger market corrections as it did in 2007, 2011, and 2015. Namely, what we can observe in those cases is that the ratio of SPY and TLT was negatively diverging from the S&P 500 on a large time frame (months). Why? SPY isn’t outperforming bonds anymore; (institutional) investors are moving out of (riskier) equities into (safer) bonds. TLT starts to outperform. See below.

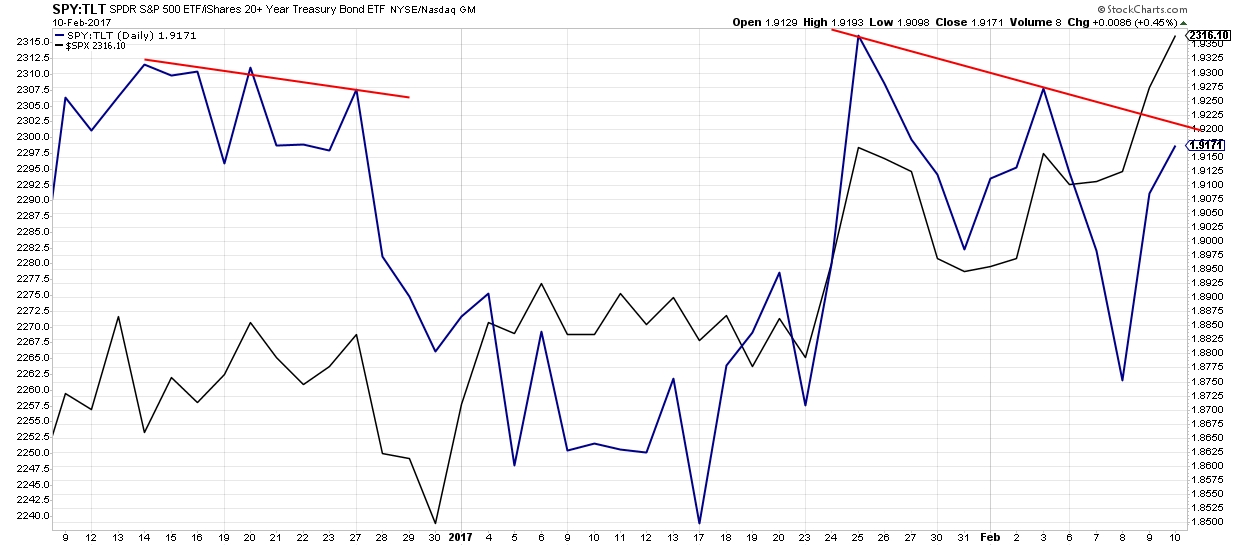
With the market making new ATHs and being in uncharted territory there’s still a lot bearishness out there as many investors haven’t jumped on the bull band wagon yet (see here), but that may quickly change. Nonetheless, we do not observe any current long term negative divergence. All we can observe is a small divergence between now and late January; similar to December 2016 (see below). Back then all we got was a 30p (~1.5%) correction. If our Elliot Wave count of the market is correct (see here for the COMPQ), then we expect something similar (30-50p) soon, which is inline with what the SPY:TLT ratio is currently telling us.

