The 4.1% plunge in the S&P 500 yesterday looks ominous, all the more so since it follows last week’s hefty 3.8% decline. But focusing on what just happened distorts our capacity to maintain a healthy sense of historical perspective. As an antidote, let’s step back and consider the latest market action through a longer-term lens.
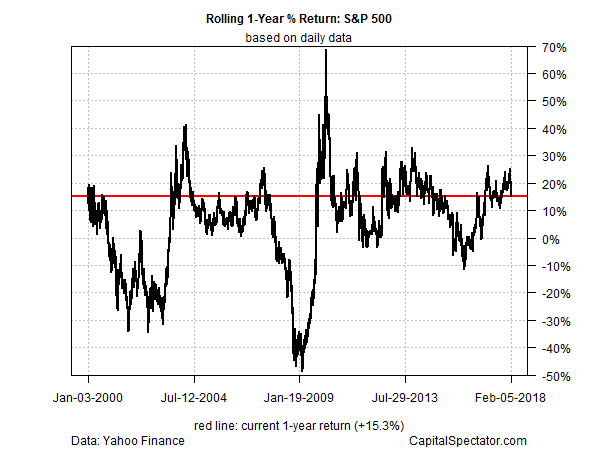
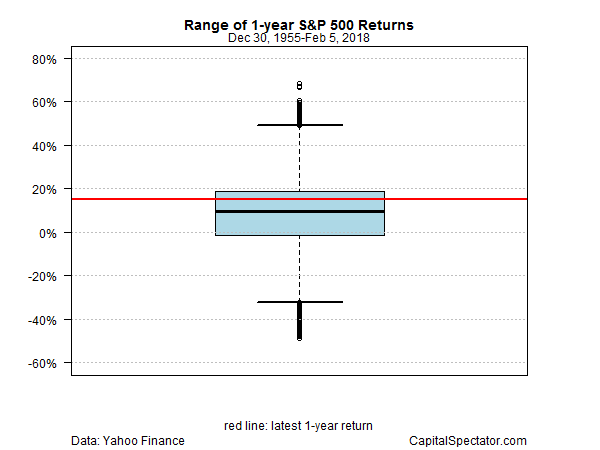
Despite Mr. Market’s latest hissy fit, the current one-year return for the US stock market is still relatively high. At yesterday’s close (Feb. 5), the S&P 500 was up 15.3%, which still represents a substantial premium vs. the long-run trend.

A 15.3% one-year return ranks at roughly the 68th percentile since 1955, which means that 67% of one-year returns over the last 60 years-plus have been lower.

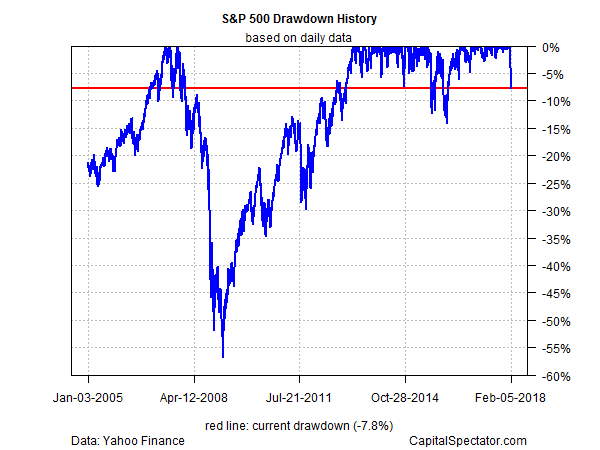
The S&P’s current drawdown is -7.8%, which is striking only because the peak-to-trough decline was zero as recently as Jan. 26. Nonetheless, despite the latest market rout the sharp slide in prices still leaves the S&P’s drawdown at a relatively middling level compared with the last several years.

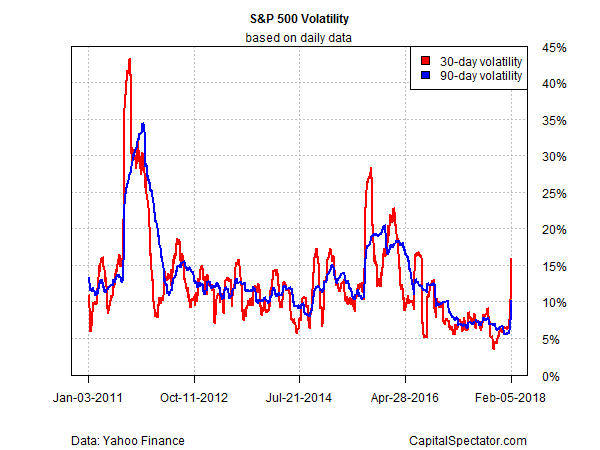
Volatility has shot up in recent days. Yet even after the latest plunge the trailing 30- and 90-day measures of volatility (annualized standard deviation) for the S&P are middling vs. recent history.

The question, of course, is whether the selling will continue? No one really knows, but it’s reasonable to assume that the slide will soon hit a floor, if it hasn’t already, without a deterioration in the economic trend, which for the moment remains moderately positive.
Stephane Barbier de la Serre, a strategist at Makor Capital Markets, reminds that “fundamentals have not been snuffed out overnight, so we reckon that in short-term view, the current crash is unlikely to go much beyond 15% peak-to-trough on aggregate.”
By that reasoning, with the S&P’s current drawdown at roughly -8%, the market is still vulnerable to another downdraft.
Meantime, the crowd appears inclined to reprice stocks for a higher level of inflation and interest rates. That’s a problem if you were 1) valuing equities at nosebleed levels; 2) assuming that Treasury yields would remain more or less flat for the foreseeable future; 3) and economic growth would accelerate sharply with no impact on monetary policy. For a brief, fleeting moment in January investors were drinking the Kool-Aid on that narrative. February, by contrast, has delivered a dose of reality. It’s not the end of the world, unless you’re were only using last month’s numbers for context.
